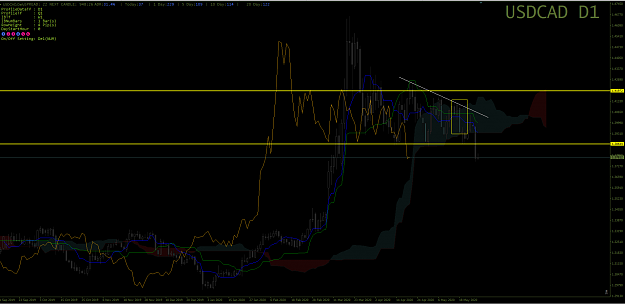
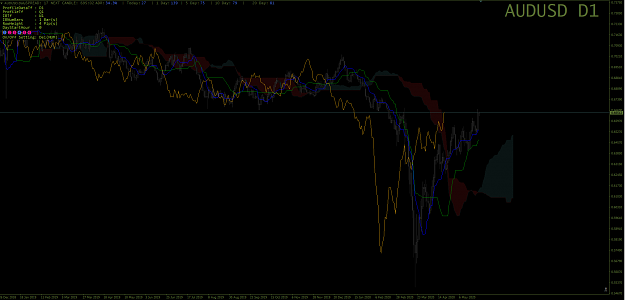
-above is tf D1, market start range from 3.26.2020
-strong major resistance (1.4200)
strong major resistance (1.3865)
-engulfing cs has appear on 18.05.2020 and break minor resistance at price level 1.4042
Attached Image (click to enlarge)
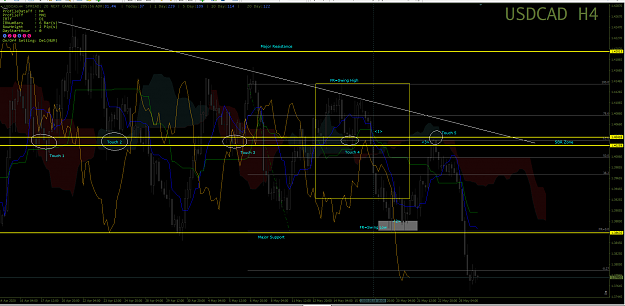
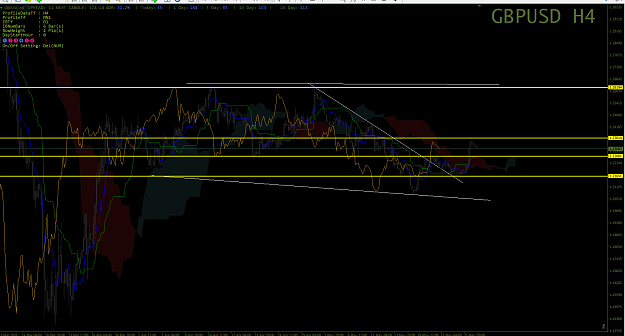
-on TF H4, price has touch many times at SBR/RBS zone.
-on 18.05.2020, price has break minor resistance (<1>), and price stop at major support,Double Bottom has appear (<2>). The price try to break the support zone but the retraced back at RBS Zone and touch exactly on Senko B line (Touch 5).
-Using Fibonacci Retracement the price is on 61.8 area.
-Waiting for breakout on smaller TF. (Look for Selling Edge)
Attached Image (click to enlarge)
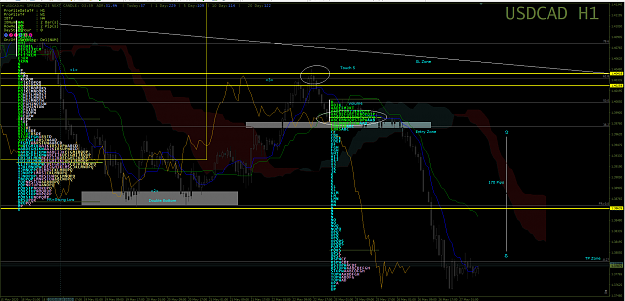
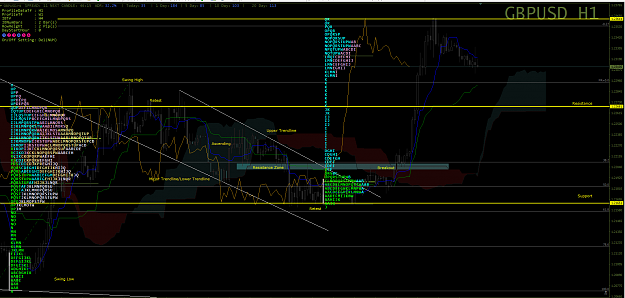
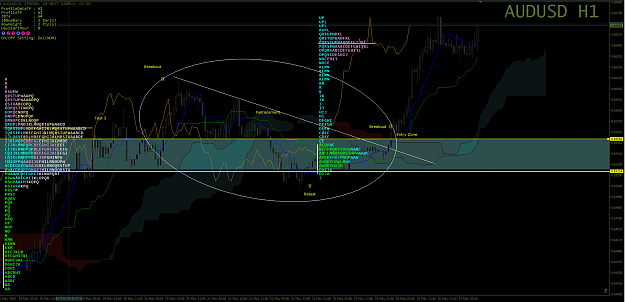
-tf H1, on 22.05.2020,price reach Resistance level (Touch 5, 61.8%) and start to going down.
-comfirmation before selling:
1. wait until price break 1.397 (mini support)
2. tenkan-sen and kijun sen cross
3. chikou span cross the cs 26days ago
4. price below kumo(cloud)
Attached Image (click to enlarge)
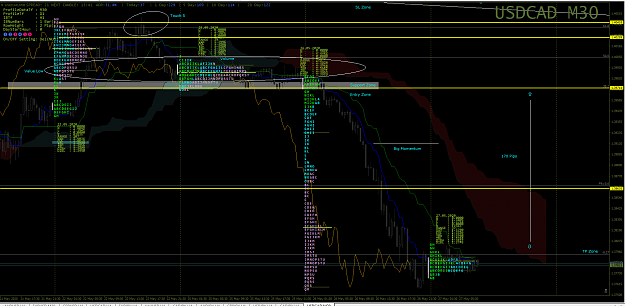
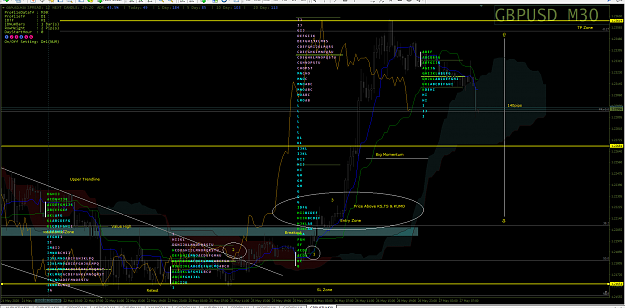
-on TF M30, price is below 22.05.2020 Value Low Area, day after that,big volume appear on the chart.
-wait for the support zone to break and sell.
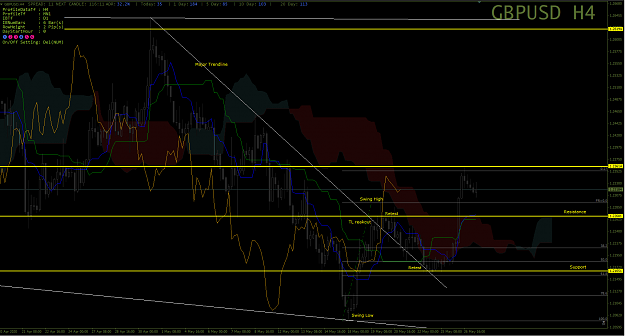
-on TF H4, price break major trendline, and retest resistance zone at price 1.227.
-and it retrace support area 1.216 around 50%-61.8% fibo zone.
-refer to lower TF to see which way price would go.
Attached Image (click to enlarge)
-on TF H1, after retest the support area, price is in range for couple of hours.
-on 26.05.2020, Bullish Engulfing has appear and wait for the price to break resistance zone before to entry buy
Attached Image (click to enlarge)
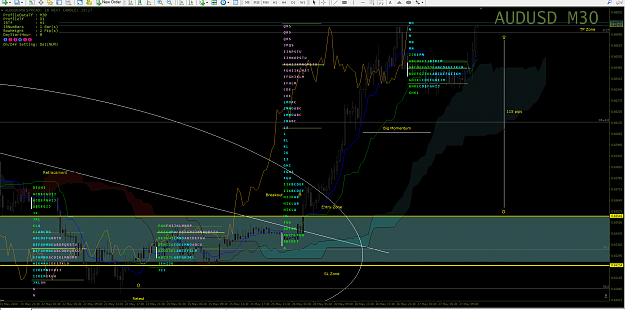
-TF M30,after price break resistance zone and value high 22/05/2020.
-Comfirmation before entry Buy is :
1. Kijun Sen and Tenkan Sen Cross
2. Chikou Span break price
3. Price is above TS,KS and Kumo
4. Data of Volume previous day
5. Kumo Twist and Angle
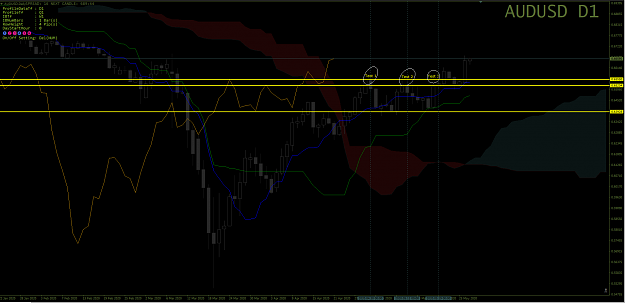
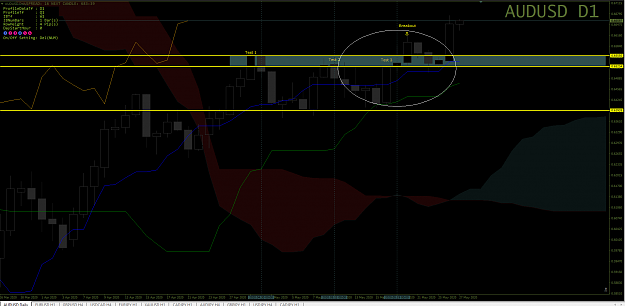
-on TF D1, price as retest strong resistance zone 3 times on 30/4, 11/5 & 19/5.
Attached Image (click to enlarge)
-on the next day 20/5, price level 0.6555 has been break then after 3 days later the price retraced back to the RBS Zone on 25/05. ( DarkSlateColour Rectangle,RBS Zone).
Attached Image (click to enlarge)
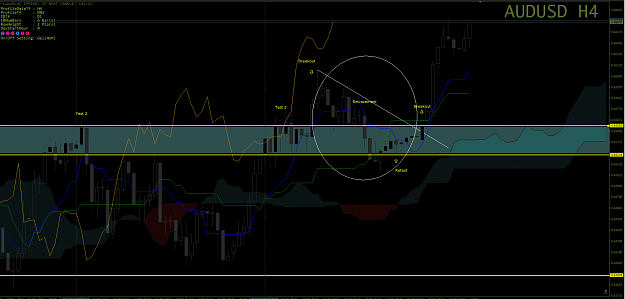
-on TF H4, after retracement, the price retest around support area 0.6420
-on 26/05 0.6555 has been break again and now look for buy chance.
Attached Image (click to enlarge)
Attached Image (click to enlarge)
-on TF M30, Entry Zone has been identified and must comfirm before buying:
1. TS&KS crossing and moving upwards
2. CS cross previous price and moving upwards
3. Price above Kumo
4. Price break previous Value High Area
5. High Volume on support area
5. Kumo twist and angle in upwards direction