Okay Noobs, (Highly profitable method)
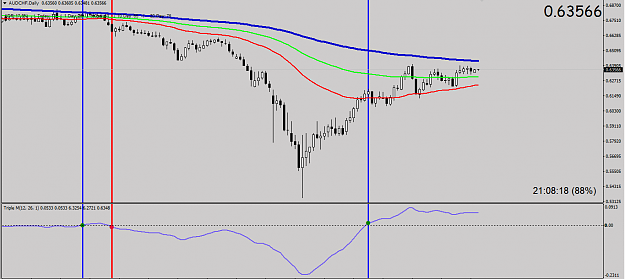
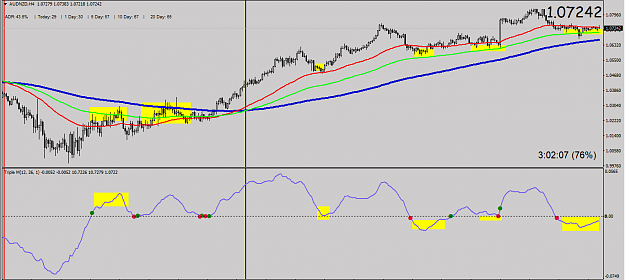
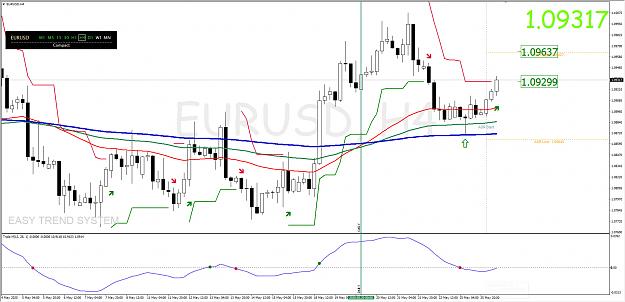
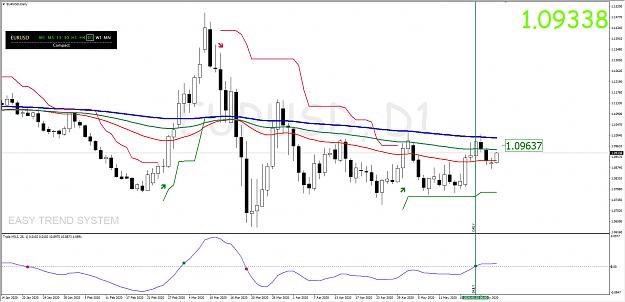
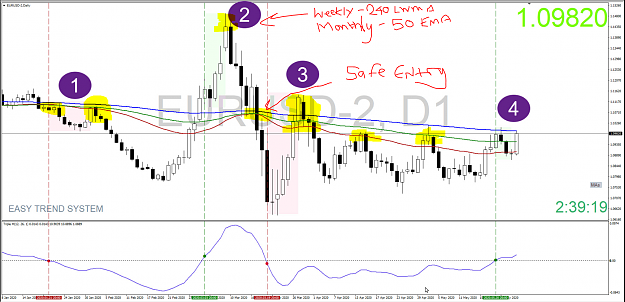
Today is a holiday for me so I am going to share something very simple. Please try on a demo account. I deleted my other indicators, because you must make the TP and SL your own. This is very simple. MA's are your trigger areas to enter a trade, is it laser accurate, NO it is a zone not a price action decision. Always look at the 1st dip/rally after the MA flip. On the daily, you will get about 1 entry/exit per week using the 4H for entry when price hits the MA's. But the pips won will be more than lower time frames. After you become comfortable with the system and modify it for your own, you can trade shorter time frames if you want.
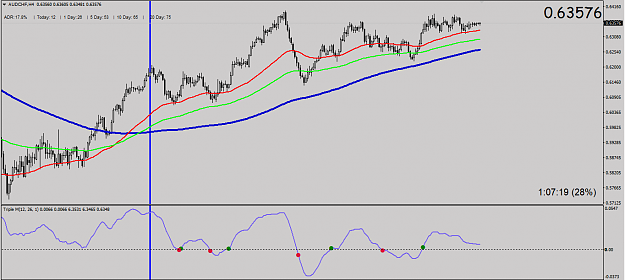
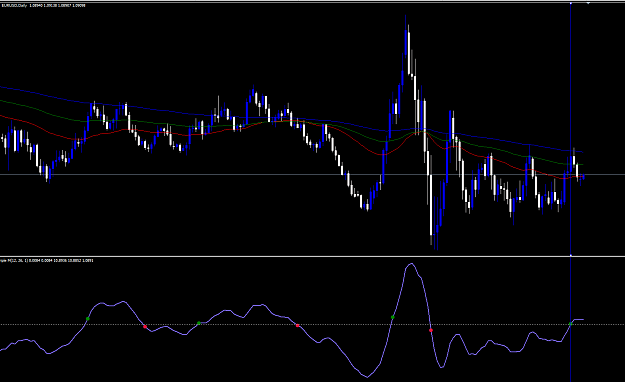
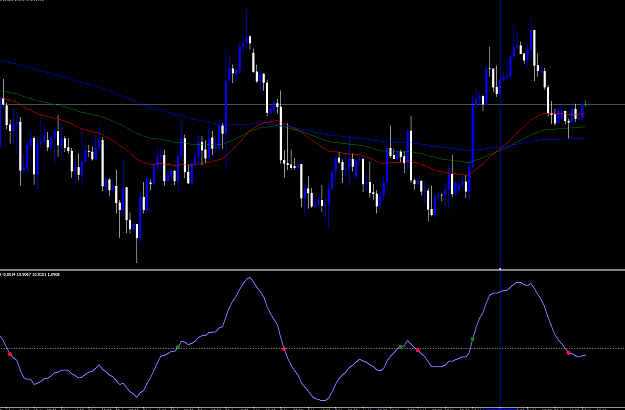
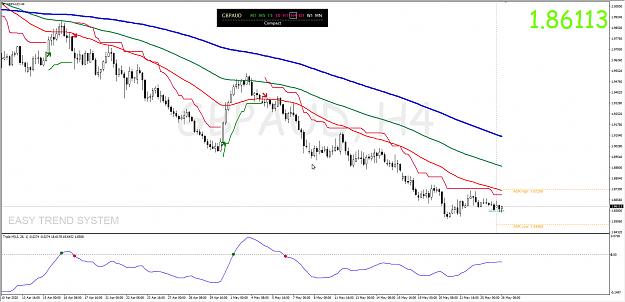
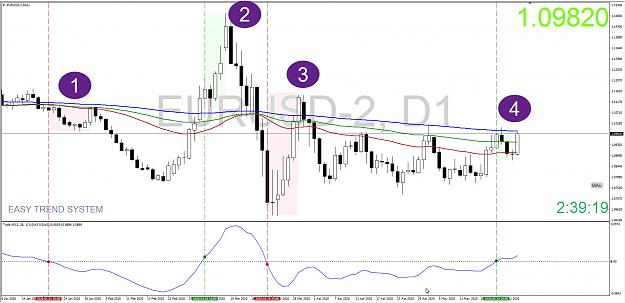
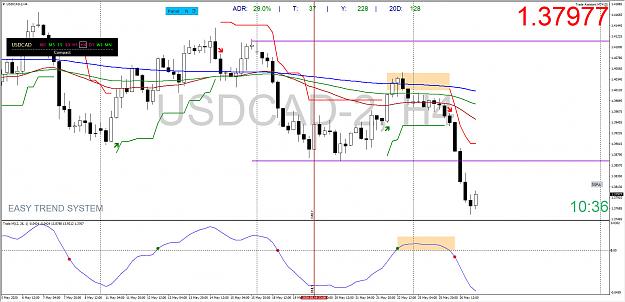
There are many good traders here in FF, some use S/R, Supply/Demand zones, MACD, etc. You will need to figure out what works best for you. This is just to get you started and understand the meaning of riding waves. If you want to be safe, do not trade against the direction of the MA's. Blue on top means it is going down, blue on bottom means it is going up. PM me if you have a question. This is not rocket science, do not make it harder than what it is. After drawing a blue or red line for each dot, you will see the MA's flip on the next lower time frame. Example as seen below on the Daily, bump down to the 4H chart after drawing these, trade in that direction. Simple. Read the rules below so you can add your indicators.
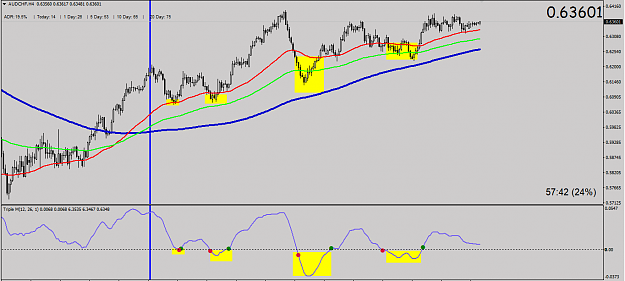
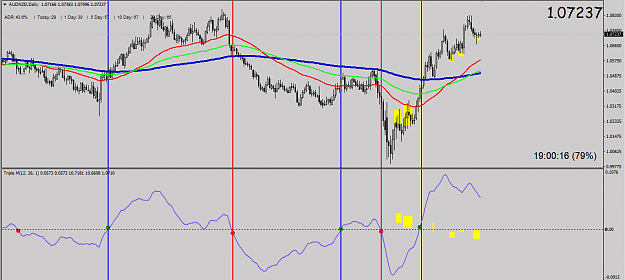
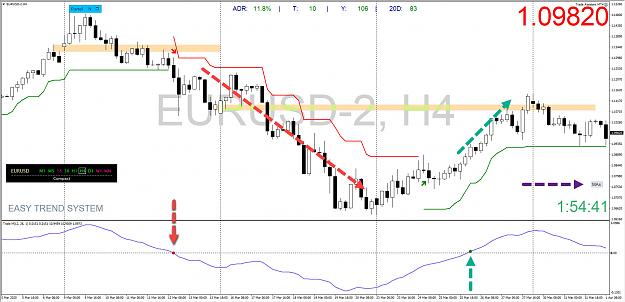
This will help you find dips/rally's. After marking dots on the daily switch to the 4H chart or 4H/1H on EURUSD. After first dip/rally you will see the pattern where MACD Marker typically crosses 0.00 and back again, that gap is the entry area. YES, I use another indicator to see this, but you mus t make it your own. Do yourhomework.
This is for high probability, if you trade so price will come back into MA's(Against trend) it is high risk. That is on you. I do not take any responsibility for losses or gains.
MA's
Red=50EMA
Green=100EMA
Blue=240LWMA
Remember if you want to modify this strategy that is fine, here are the basics. We need a few things for riding waves.
#1 Need a way to identify the trend
#2 Have an indicator for identifying the trigger zone for entering
#3 Have a SL Strategy(Mine is mental and keep track of S/R areas as well as Price Action)
#4 Have an indicator or method for identifying the TP zones (I use Davit's pivots, but that is me. You use your own, once you are experienced for 2 years, should check his thread. He is an amazing trader. People try to copy him, but there is only 1 Davit. He is an amazing trader for advanced methods and fundamentals. Cannot say enough great things about the man, truly awesome.)
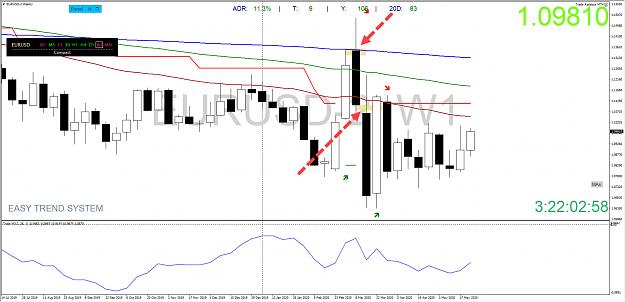
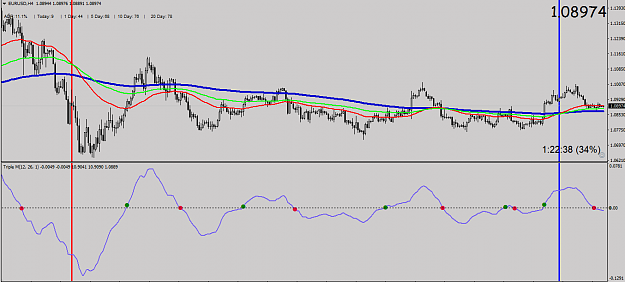
Yes you can use this method on 1D/4H, 4H/1H and 1H/30M(More volatility on lower time frames), but don't until you understand it. Attached is the MACD Marker indicator, change the settings to 12,26,1
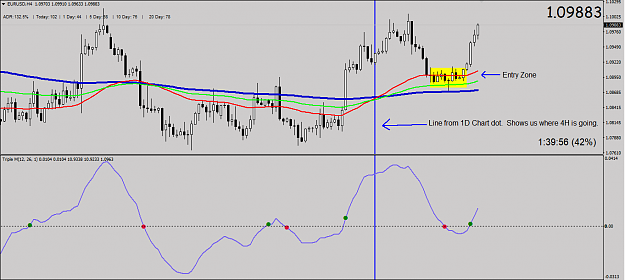
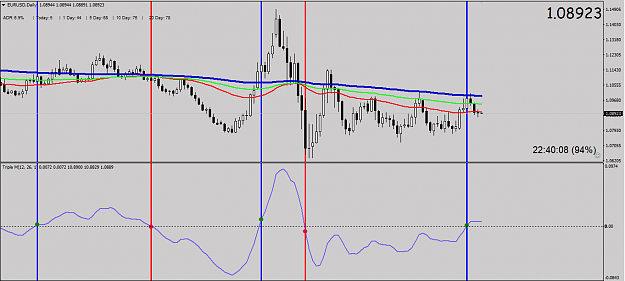
Start with 1D/4H. That means draw the lines on the 1D and look at 4H chart for when PA hits the MA's.
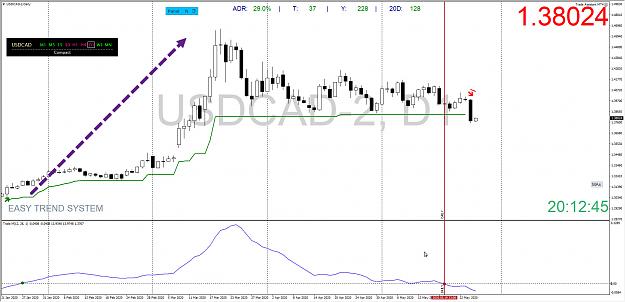
Keep it simple, look at on multiple pairs.
So, please post your thoughts, it does not matter if you are demo or live.
NO BASHING will be tolerated. We are here to learn.
Please feel free to share your TP and SL indicators if you like. This thread will be for learning purposes. For the sake of the thread, if you have an indicator better than a posters, post it.
That is it for now. Hope this helps some people. Remember, there are MANY WAYS TO TRADE AND MAY TIME FRAMES. Please post your time frame so others are not confused with your charts.
Today is a holiday for me so I am going to share something very simple. Please try on a demo account. I deleted my other indicators, because you must make the TP and SL your own. This is very simple. MA's are your trigger areas to enter a trade, is it laser accurate, NO it is a zone not a price action decision. Always look at the 1st dip/rally after the MA flip. On the daily, you will get about 1 entry/exit per week using the 4H for entry when price hits the MA's. But the pips won will be more than lower time frames. After you become comfortable with the system and modify it for your own, you can trade shorter time frames if you want.
There are many good traders here in FF, some use S/R, Supply/Demand zones, MACD, etc. You will need to figure out what works best for you. This is just to get you started and understand the meaning of riding waves. If you want to be safe, do not trade against the direction of the MA's. Blue on top means it is going down, blue on bottom means it is going up. PM me if you have a question. This is not rocket science, do not make it harder than what it is. After drawing a blue or red line for each dot, you will see the MA's flip on the next lower time frame. Example as seen below on the Daily, bump down to the 4H chart after drawing these, trade in that direction. Simple. Read the rules below so you can add your indicators.
This will help you find dips/rally's. After marking dots on the daily switch to the 4H chart or 4H/1H on EURUSD. After first dip/rally you will see the pattern where MACD Marker typically crosses 0.00 and back again, that gap is the entry area. YES, I use another indicator to see this, but you mus t make it your own. Do yourhomework.
This is for high probability, if you trade so price will come back into MA's(Against trend) it is high risk. That is on you. I do not take any responsibility for losses or gains.
MA's
Red=50EMA
Green=100EMA
Blue=240LWMA
Remember if you want to modify this strategy that is fine, here are the basics. We need a few things for riding waves.
#1 Need a way to identify the trend
#2 Have an indicator for identifying the trigger zone for entering
#3 Have a SL Strategy(Mine is mental and keep track of S/R areas as well as Price Action)
#4 Have an indicator or method for identifying the TP zones (I use Davit's pivots, but that is me. You use your own, once you are experienced for 2 years, should check his thread. He is an amazing trader. People try to copy him, but there is only 1 Davit. He is an amazing trader for advanced methods and fundamentals. Cannot say enough great things about the man, truly awesome.)
Yes you can use this method on 1D/4H, 4H/1H and 1H/30M(More volatility on lower time frames), but don't until you understand it. Attached is the MACD Marker indicator, change the settings to 12,26,1
Start with 1D/4H. That means draw the lines on the 1D and look at 4H chart for when PA hits the MA's.
Keep it simple, look at on multiple pairs.
So, please post your thoughts, it does not matter if you are demo or live.
NO BASHING will be tolerated. We are here to learn.
Please feel free to share your TP and SL indicators if you like. This thread will be for learning purposes. For the sake of the thread, if you have an indicator better than a posters, post it.
That is it for now. Hope this helps some people. Remember, there are MANY WAYS TO TRADE AND MAY TIME FRAMES. Please post your time frame so others are not confused with your charts.
Attached Image(s) (click to enlarge)
Attached File(s)
"What the wise do in the beginning, fools do in the end."-Warren Buffet