Hello.
I felt it is now time to share with you guys my StoGAPtic strategy (trying to be creative with the name here… don’t kill me if you do not like it…).
Writing down my StoGAPtic strategy and presenting it to other people forces me to carefully think it over, finalise it, and even remember it better. Also, and this is very important to me, I am sharing this so that others can test it, try it, critically review it, and hopefully perfect/improve it. I hope you agree.
Also, my hidden secret is that I actually want more and more people to use my strategy… because the more people think like me and act/buy like me, the more likely it becomes that price will move in my direction and more likely for me to make money , right?? I do not understand people who “hide” their strategies… Actually, I do… Assuming they are not stupid, they do not disclose their strategies because they know these strategies do not work in real trading and therefore they try to sell them to others. Anyway, let me not go into philosophical blahblah…
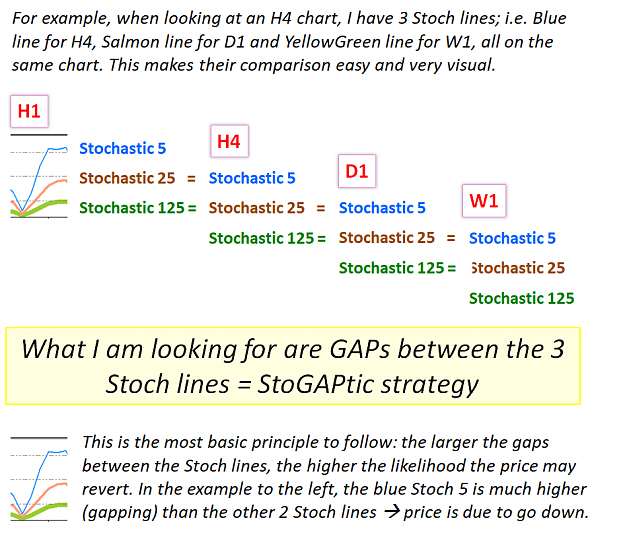
StoGAPtic basically stands for Stochastic Gap analysis since I am using and comparing several stochastic indicators in the same indicator window (I used to have 4 stoch lines but reduced them to 3 as I think these are enough). I am attaching my template and all the indicators that appear in it.
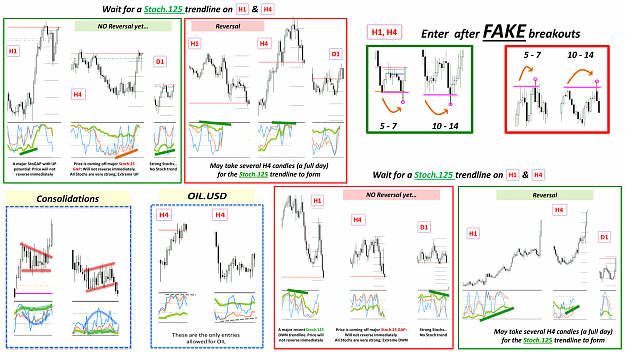
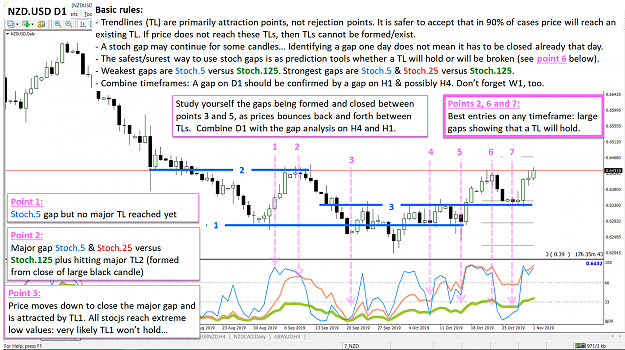
My theory behind StoGAPtic: The stochastic gives me an indication as to how extended (you may also call it overbought/oversold) the current price is over the chosen period. For most forex pairs and in most of the timeframes (especially H4, D1 and W1) the shortest period/cycle that can be identified is 5-7 candles. Thus:
- I am using Stochastic 5 period (Blue line) in order to see where the current close is versus this shortest identifiable cycle of 5-7 candles. Note that I am only using %K (I do not care about %D).
- Then I overlay Stochastic 25 period (5x5; Salmon line) as it would roughly correspond to the next higher timeframe; and Stochastic 125 period (5x5x5; YellowGreen line) which would correspond to the next higher timeframe.
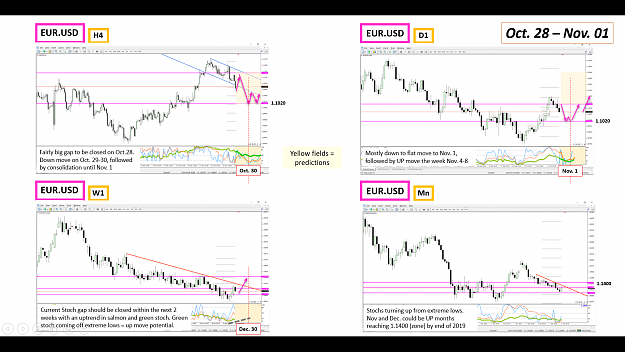
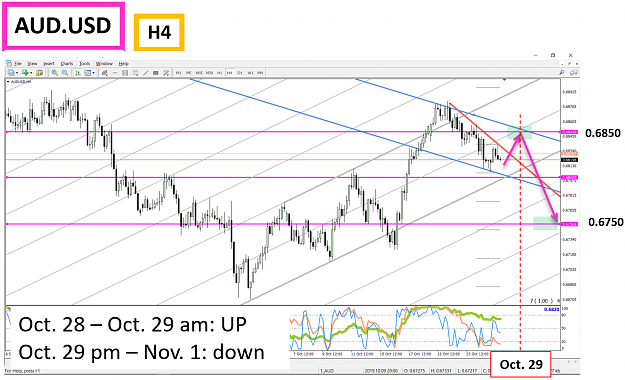
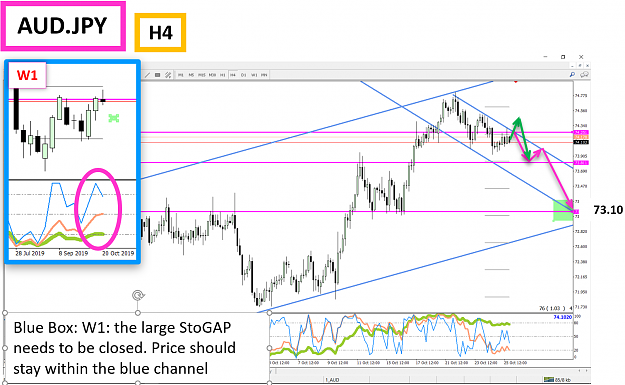
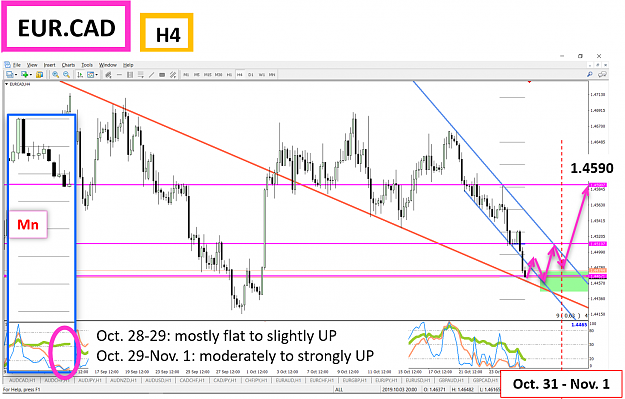
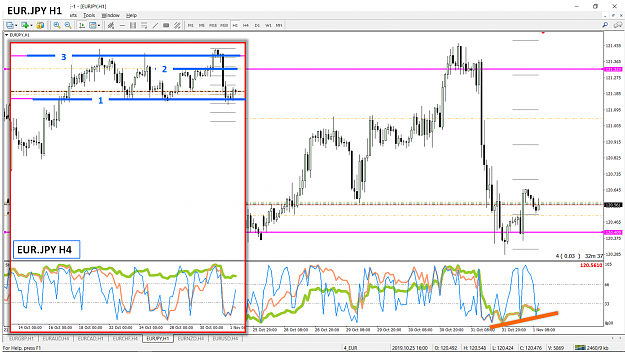
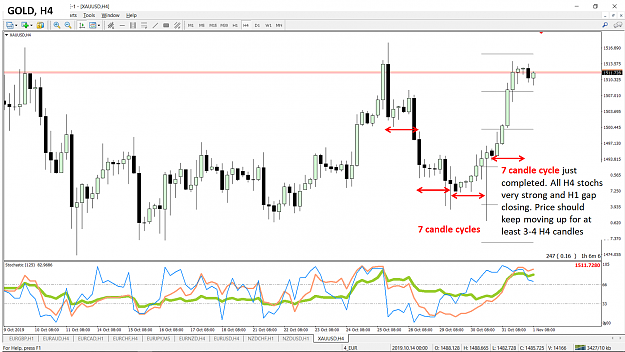
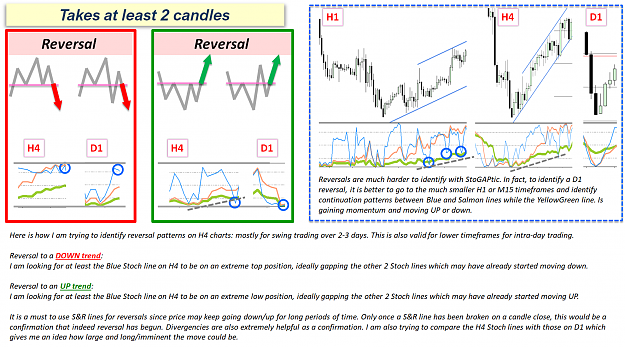
Please see the examples in the image below.
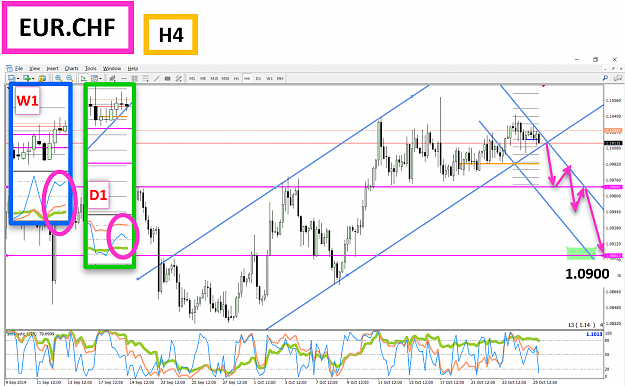
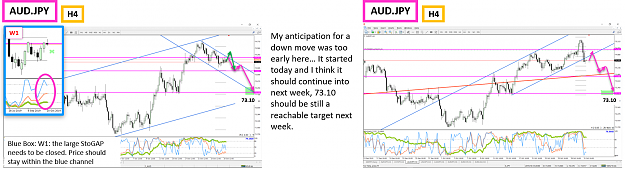
IMPORTANT NOTE: I do not rely on the Stochastic gaps only. They should only be used in conjunction with trendlines/channels and S&R lines.
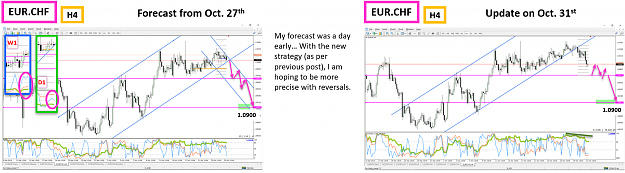
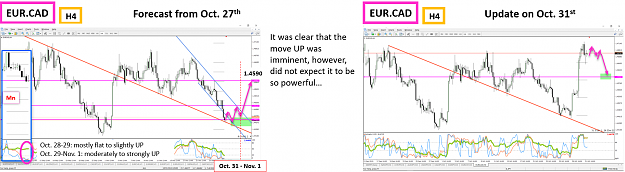
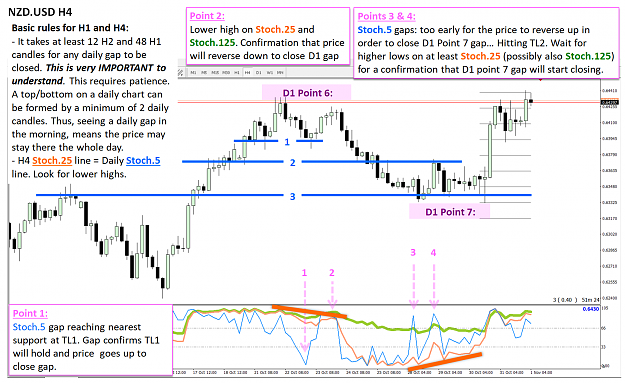
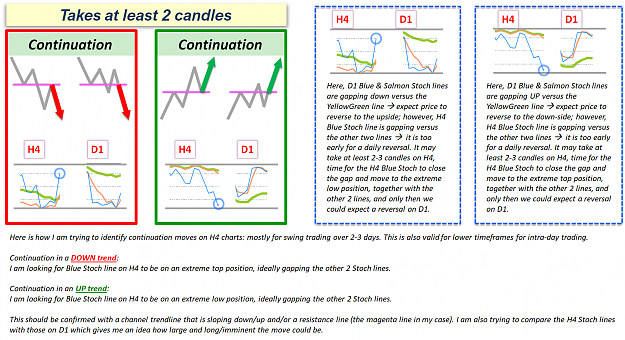
As with any strategy, this is not a flawless way of making your analysis. Trading and chart reading is and will remain an art. Continuation patterns are easier to identify and are more reliable with the StoGAPtic; I am still struggling myself with the reversals… I identify them too early and therefore often enter too early… cannot overcome the greed… As you know psychology is a major part in trading… This is why I put in BIG letters “Takes at least 2 candles” to remind myself that reversals (and even continuations) do not happen suddenly, especially on H4 and D1 charts.
When I look at the charts in the morning, I have to constantly remind myself that there are still at least 4-5 H4 candles until the end of the trading day; thus, should be patient and wait for the identified reversal until the next D1 candle.
I will be posting my analysis using this strategy in this thread; I hope others can do it too.
I would like to ask those of you who would like to respond to be polite and useful/constructive with your comments. I am offering you my learnings and knowledge and hope to get some of your knowledge, too. I do not consider very useful posting “entered long at… level” or “I exited with a profit of 20 pips”… I would really like to see my thread as source of market ideas, visions and predictions.
Thanks to all in advance for any contribution to the StoGAPtic strategy. And, please, do not use this strategy in real life trading unless you master it…
I felt it is now time to share with you guys my StoGAPtic strategy (trying to be creative with the name here… don’t kill me if you do not like it…).
Writing down my StoGAPtic strategy and presenting it to other people forces me to carefully think it over, finalise it, and even remember it better. Also, and this is very important to me, I am sharing this so that others can test it, try it, critically review it, and hopefully perfect/improve it. I hope you agree.
Also, my hidden secret is that I actually want more and more people to use my strategy… because the more people think like me and act/buy like me, the more likely it becomes that price will move in my direction and more likely for me to make money
StoGAPtic basically stands for Stochastic Gap analysis since I am using and comparing several stochastic indicators in the same indicator window (I used to have 4 stoch lines but reduced them to 3 as I think these are enough). I am attaching my template and all the indicators that appear in it.
My theory behind StoGAPtic: The stochastic gives me an indication as to how extended (you may also call it overbought/oversold) the current price is over the chosen period. For most forex pairs and in most of the timeframes (especially H4, D1 and W1) the shortest period/cycle that can be identified is 5-7 candles. Thus:
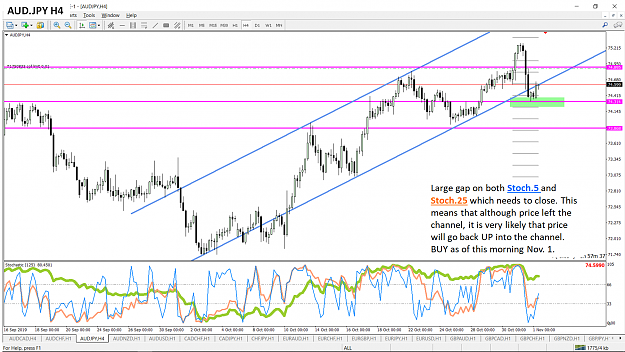
- I am using Stochastic 5 period (Blue line) in order to see where the current close is versus this shortest identifiable cycle of 5-7 candles. Note that I am only using %K (I do not care about %D).
- Then I overlay Stochastic 25 period (5x5; Salmon line) as it would roughly correspond to the next higher timeframe; and Stochastic 125 period (5x5x5; YellowGreen line) which would correspond to the next higher timeframe.
Please see the examples in the image below.
IMPORTANT NOTE: I do not rely on the Stochastic gaps only. They should only be used in conjunction with trendlines/channels and S&R lines.
As with any strategy, this is not a flawless way of making your analysis. Trading and chart reading is and will remain an art. Continuation patterns are easier to identify and are more reliable with the StoGAPtic; I am still struggling myself with the reversals… I identify them too early and therefore often enter too early… cannot overcome the greed… As you know psychology is a major part in trading… This is why I put in BIG letters “Takes at least 2 candles” to remind myself that reversals (and even continuations) do not happen suddenly, especially on H4 and D1 charts.
When I look at the charts in the morning, I have to constantly remind myself that there are still at least 4-5 H4 candles until the end of the trading day; thus, should be patient and wait for the identified reversal until the next D1 candle.
I will be posting my analysis using this strategy in this thread; I hope others can do it too.
I would like to ask those of you who would like to respond to be polite and useful/constructive with your comments. I am offering you my learnings and knowledge and hope to get some of your knowledge, too. I do not consider very useful posting “entered long at… level” or “I exited with a profit of 20 pips”… I would really like to see my thread as source of market ideas, visions and predictions.
Thanks to all in advance for any contribution to the StoGAPtic strategy. And, please, do not use this strategy in real life trading unless you master it…
Attached Image (click to enlarge)
Attached Image (click to enlarge)
Attached Image (click to enlarge)
Attached File(s)