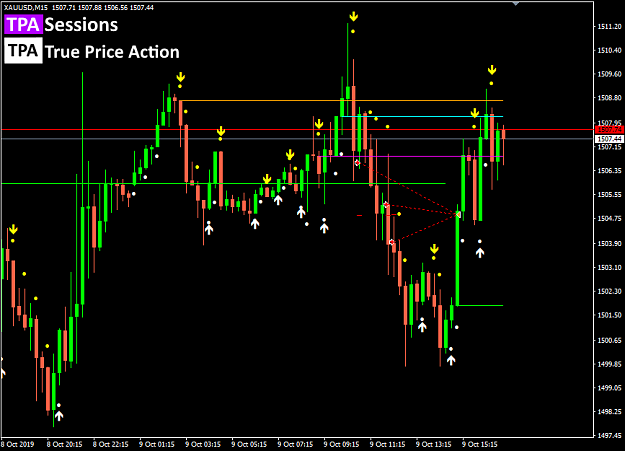
I'd like to introduce a few trade trade examples of XAUUSD with using TPA True Price Action Indicator for MT4 & MT5 and TPA Sessions Indicator.
TPA is revealing, what market makers are actually doing in a certain amount of time.
TPA shows exactly what is going on between the bulls and the bears !
Without repainting or recalculation, candle by candle, even ten in a row with the same color. If there is an arrow with a dot, or just a dot, it stays there, no matter what happens next, no matter what market, no matter what timeframe.
"Arrow with dot" signals a change in control between the bulls and bears. You can turn off the arrows, if you don`t need that extra information, or if you want less signals on your chart. You can see the "change" by the different color of the dots too.
"Dot" signals a reentry, or a scale in (add on) trade into the current trend direction.
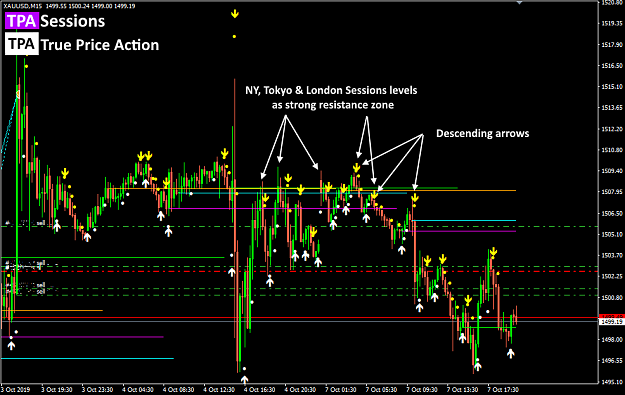
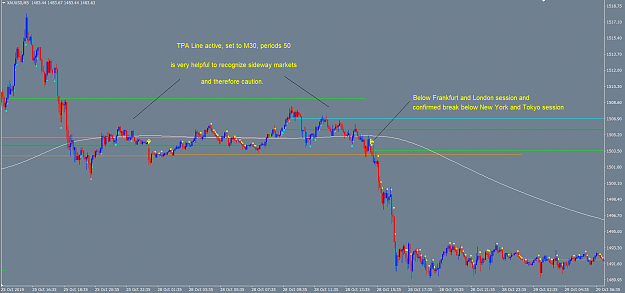
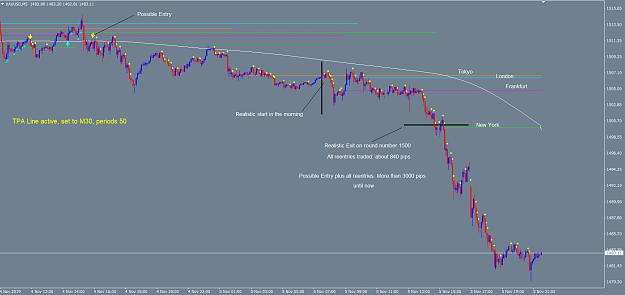
"TPA Sessions" indicator is a very important tool to complement "TPA True Price Action" indicator.
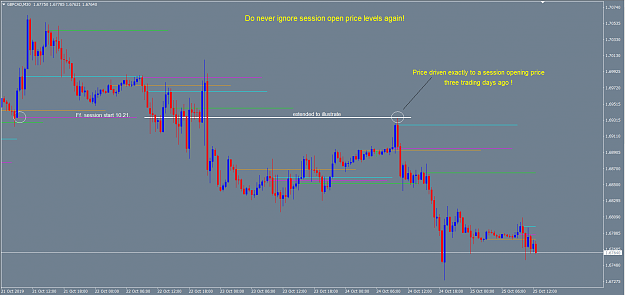
Session opening prices, where market makers let price return, to draw in the opposite participants, into the direction of their goal.
This is one of the methods, market makers use, to give a "discount" to reach the price levels they want.
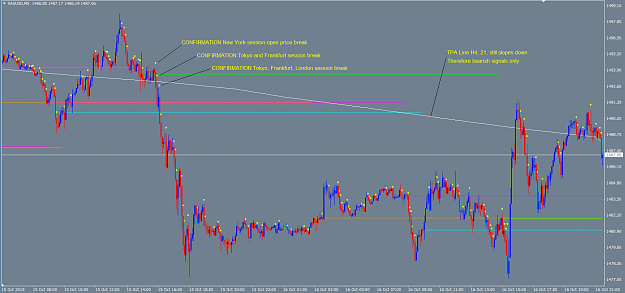
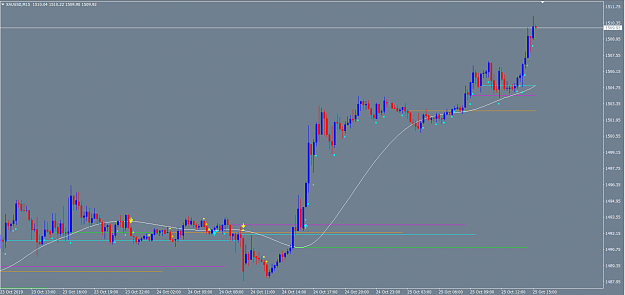
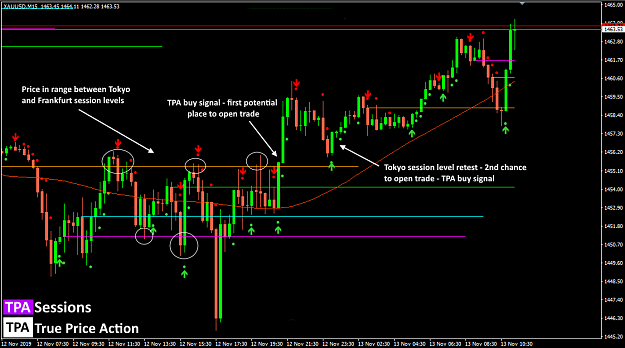
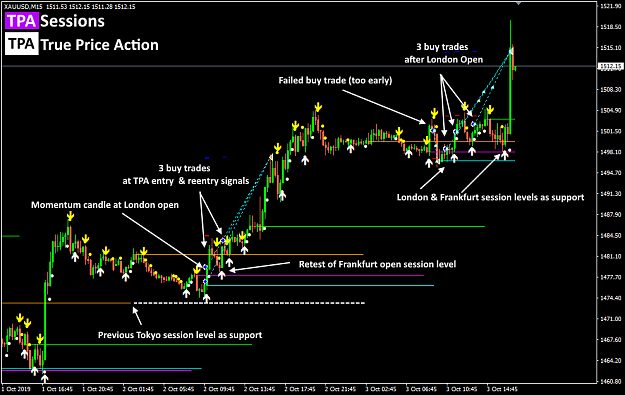
Here is a chart with last trades on XAUUSD:
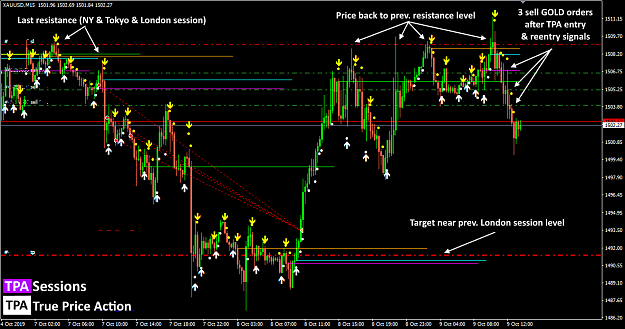
Yesterday (02.10.2019) I have opened 3 buy trades after London open momentum candle. See, how price respect Tokyo session line as support.
Today (03.10.2019) I have opened Buy trade too early, and this was closed with loss, but after London open and see how price is respecting this level, I have decided to open next buy trade on XAUUSD. When True Price Action has confirmed up direction with buy signal and reentry signals, I have decided to open next 2 buy orders.
All 3 orders was closed with profit. See how price respected Tokyo (orange line) and Frankfurt (magenta line) before it shot up.
TPA is revealing, what market makers are actually doing in a certain amount of time.
TPA shows exactly what is going on between the bulls and the bears !
Without repainting or recalculation, candle by candle, even ten in a row with the same color. If there is an arrow with a dot, or just a dot, it stays there, no matter what happens next, no matter what market, no matter what timeframe.
"Arrow with dot" signals a change in control between the bulls and bears. You can turn off the arrows, if you don`t need that extra information, or if you want less signals on your chart. You can see the "change" by the different color of the dots too.
"Dot" signals a reentry, or a scale in (add on) trade into the current trend direction.
"TPA Sessions" indicator is a very important tool to complement "TPA True Price Action" indicator.
Session opening prices, where market makers let price return, to draw in the opposite participants, into the direction of their goal.
This is one of the methods, market makers use, to give a "discount" to reach the price levels they want.
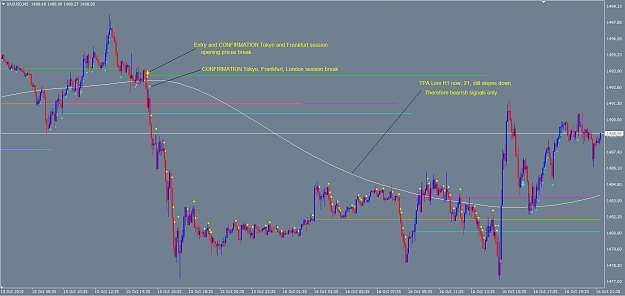
Here is a chart with last trades on XAUUSD:
Attached Image (click to enlarge)
Yesterday (02.10.2019) I have opened 3 buy trades after London open momentum candle. See, how price respect Tokyo session line as support.
Today (03.10.2019) I have opened Buy trade too early, and this was closed with loss, but after London open and see how price is respecting this level, I have decided to open next buy trade on XAUUSD. When True Price Action has confirmed up direction with buy signal and reentry signals, I have decided to open next 2 buy orders.
All 3 orders was closed with profit. See how price respected Tokyo (orange line) and Frankfurt (magenta line) before it shot up.