Hi,
I have been using an ADR indicator for a few years now because I need to know how many pips a currency pair has moved in relation to yesterday,
and long term, monthly or 6 monthly. and also how far price has moved from the low or high of the day.
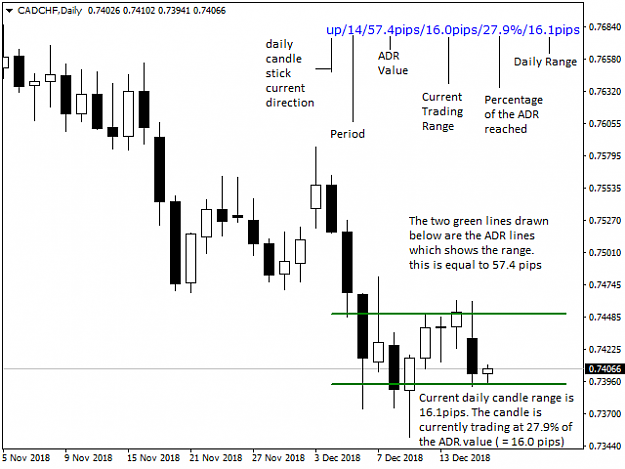
The indicator prints the current pip distance from the daily top (H) and to the daily bottom (L) in pips.
This could be useful if you have seen the pair do a move and retrace and you can't tell how far away it has moved.
Also, by adding the low and high in our head we can quickly see how many pips the pair has done for the day.
So if today a pair has done at least the average daily number of pips, then perhaps a BIG continuation is unlikely.
Selling bottoms and buying tops is not a good idea.
INDICATOR READINGS:
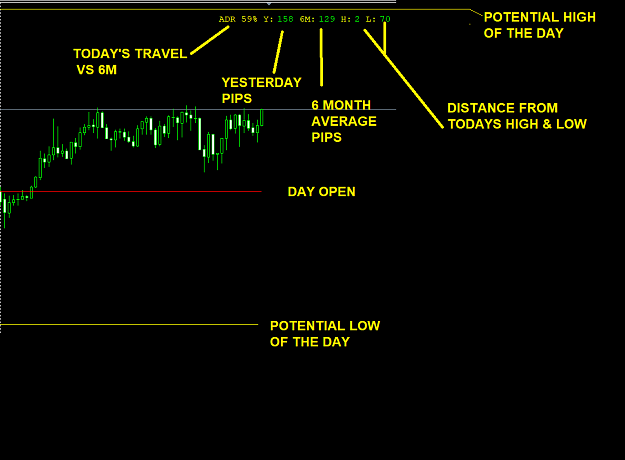
ADR% = percentage of today's price move Vs the 6Monthly average
Y = yesterday's pips
M = Monthly Average Pips
6M = 6 Monthly Average Pips
H = Distance of current price to today's High
L = Distance of current price to today's Low
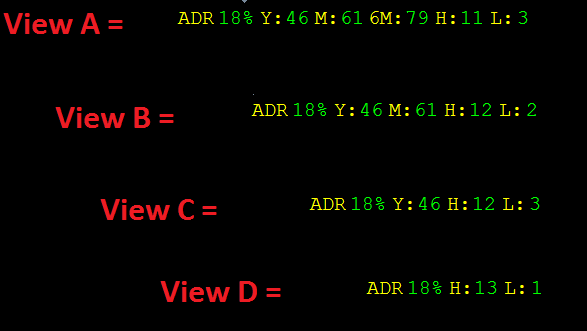
Note: Most of the readings + lines can be turned OFF if not needed (see post 7 for different view options)
If you don't want to see the Monthly and 6 Monthly they can be hidden by selecting FALSE in the settings.
I have set the monthly and 6 monthly to 30 and 180 days but if you are paranoid about accuracy you can change the settings to 22 days for the month or 132 for 6 months
EDIT 31 JULY 2020
1. Added alert for reaching 100% ADR
2. Added color change for % reading of <>100%
3. Added daily open line because some traders use it for directional bias (above the line they only buy and below the line they only sell)
4. Added ADR High and Low line so we can see where the likely day's limits are.
The yellow ADR lines (the potential high and low) are dynamic, i.e the line moves as the day expands and the line will stop moving at 6M value
so if the max pips (6M) are reached near a major support or Resistance level, then that could be a good level to get out of a trade or to reverse trade.
5. Added 2 inputs for the selection of colours for ADR% readings <100% (RED) and >100% (LIME)
NOTE: 1 file is for MT4 and 1 for MT5
EDIT 7 AUGUST 2020
Fixed the MT5 version, the color selection inputs for ADR % <>100 were missing
EDIT 26 DECEMBER 2021
NEW VERSION 4.1
Addet option to print the ADR lines of previous days
New Inputs:
Print_Historical_HL_Lines=true
Historical_HL_Line_Bars=5
If you want to see the ADR lines of the previous 30 days then change the number 5 to 30
I have been using an ADR indicator for a few years now because I need to know how many pips a currency pair has moved in relation to yesterday,
and long term, monthly or 6 monthly. and also how far price has moved from the low or high of the day.
The indicator prints the current pip distance from the daily top (H) and to the daily bottom (L) in pips.
This could be useful if you have seen the pair do a move and retrace and you can't tell how far away it has moved.
Also, by adding the low and high in our head we can quickly see how many pips the pair has done for the day.
So if today a pair has done at least the average daily number of pips, then perhaps a BIG continuation is unlikely.
Selling bottoms and buying tops is not a good idea.
INDICATOR READINGS:
ADR% = percentage of today's price move Vs the 6Monthly average
Y = yesterday's pips
M = Monthly Average Pips
6M = 6 Monthly Average Pips
H = Distance of current price to today's High
L = Distance of current price to today's Low
Note: Most of the readings + lines can be turned OFF if not needed (see post 7 for different view options)
If you don't want to see the Monthly and 6 Monthly they can be hidden by selecting FALSE in the settings.
I have set the monthly and 6 monthly to 30 and 180 days but if you are paranoid about accuracy you can change the settings to 22 days for the month or 132 for 6 months
EDIT 31 JULY 2020
1. Added alert for reaching 100% ADR
2. Added color change for % reading of <>100%
3. Added daily open line because some traders use it for directional bias (above the line they only buy and below the line they only sell)
4. Added ADR High and Low line so we can see where the likely day's limits are.
The yellow ADR lines (the potential high and low) are dynamic, i.e the line moves as the day expands and the line will stop moving at 6M value
so if the max pips (6M) are reached near a major support or Resistance level, then that could be a good level to get out of a trade or to reverse trade.
5. Added 2 inputs for the selection of colours for ADR% readings <100% (RED) and >100% (LIME)
NOTE: 1 file is for MT4 and 1 for MT5
EDIT 7 AUGUST 2020
Fixed the MT5 version, the color selection inputs for ADR % <>100 were missing
EDIT 26 DECEMBER 2021
NEW VERSION 4.1
Addet option to print the ADR lines of previous days
New Inputs:
Print_Historical_HL_Lines=true
Historical_HL_Line_Bars=5
If you want to see the ADR lines of the previous 30 days then change the number 5 to 30
Attached Image (click to enlarge)
Attached File(s)
Have a nice day