Got frustrated with this Forex thing for a couple of months and walked away from it. But, then once you have the bug you just have to 'take another look'...
I'm glad I did though because I came to the conclusion I was over trading. Wondered if the weekly charts would be more profitable. And, I think they potentially are.
This is my simple method:
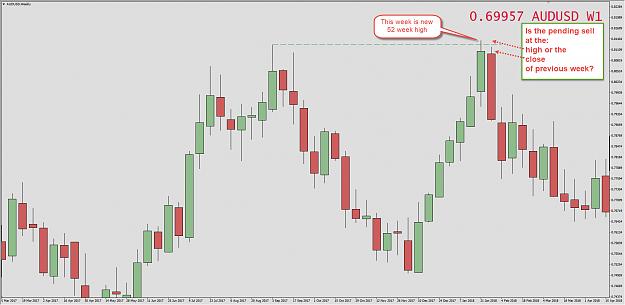
1. Look for a price to reach (or exceed) the 52 week high/low.
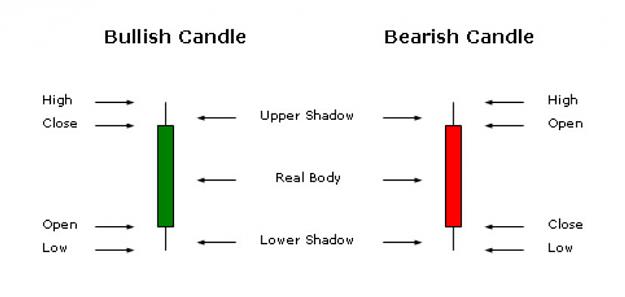
2. Then, at the close of the week look for a candlestick which may signal a potential reversal. Pin bars are my favourite for this.
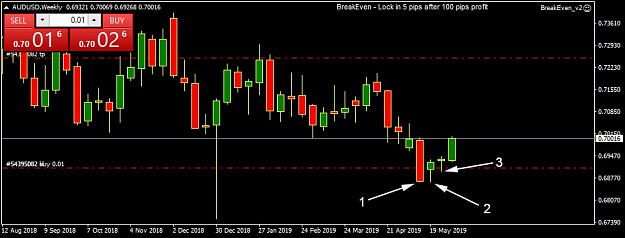
3. The opening of the following week I place my order at the previous high of the candle body (if I'm going short), or low of the candle body (if going long). This means the candle needs to retrace a bit from the close of the previous week for the order to get filled.
4. Minimum 1:4 RR based upon the next area of support/resistance. When (approx.) 100 pips profit is reached, B/E is activated.
5. If candle closes and showing a continuation of the previous trend (ie. going against my trade), I place a manual B/E. Price seems to usually hit this area again. If not, it goes down to a loss.
Waiting for the retrace before order fulfilment means I might miss some potential profitable trades but, I'm okay with that. I realise I needed to get over my fear of missing out as that makes for some bad trading decisions.
I think it really is a case of keeping things simple.
Is there anyone else who trades the weekly charts only? It seems a lot of traders like the excitement of the smaller time-frames. I don't care for excitement...I'd prefer solid trades.
I'm glad I did though because I came to the conclusion I was over trading. Wondered if the weekly charts would be more profitable. And, I think they potentially are.
This is my simple method:
1. Look for a price to reach (or exceed) the 52 week high/low.
2. Then, at the close of the week look for a candlestick which may signal a potential reversal. Pin bars are my favourite for this.
3. The opening of the following week I place my order at the previous high of the candle body (if I'm going short), or low of the candle body (if going long). This means the candle needs to retrace a bit from the close of the previous week for the order to get filled.
4. Minimum 1:4 RR based upon the next area of support/resistance. When (approx.) 100 pips profit is reached, B/E is activated.
5. If candle closes and showing a continuation of the previous trend (ie. going against my trade), I place a manual B/E. Price seems to usually hit this area again. If not, it goes down to a loss.
Waiting for the retrace before order fulfilment means I might miss some potential profitable trades but, I'm okay with that. I realise I needed to get over my fear of missing out as that makes for some bad trading decisions.
I think it really is a case of keeping things simple.
Is there anyone else who trades the weekly charts only? It seems a lot of traders like the excitement of the smaller time-frames. I don't care for excitement...I'd prefer solid trades.