Dear FF Coders -- I will be very grateful if you help me with this research i am doing on the market;
I want an indicator that draws candles on 24 hr day range in certain way --
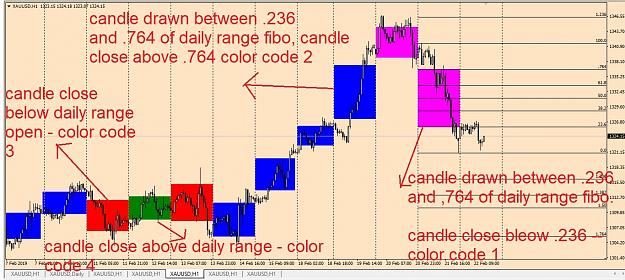
the candles drawn only between .236 and .764 daily range.
if the daily range close above .236 -- color 1.
if the daily range close below .764 -- color 2.
if daily range close below open price -- color 3.
if daily range close above open price -- color 4.
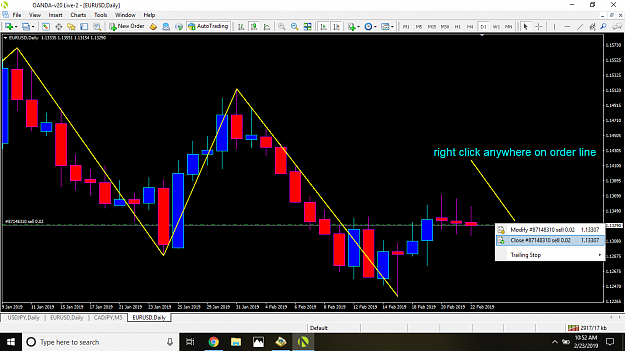
attached an image of what i do manually and was hoping to automate the thing.
Thank you in advance.
I want an indicator that draws candles on 24 hr day range in certain way --
the candles drawn only between .236 and .764 daily range.
if the daily range close above .236 -- color 1.
if the daily range close below .764 -- color 2.
if daily range close below open price -- color 3.
if daily range close above open price -- color 4.
attached an image of what i do manually and was hoping to automate the thing.
Thank you in advance.
Attached Image (click to enlarge)