OK, so I have been away from the markets for quite some time, but trading always pulls me back... it is a bit like an addict who although gives up, and has that little token, saying 1 week... 1 month... 3 months... 6 months... 1 year... 18 months.... 2 years... Oh crap.... 1 hour.... etc etc... I am back on it... or off it depending.
in the meantime - i have been doing a LOT of thinking... and actually playing A LOT MORE poker... (and yes i am winning, but have hit a downswing which make me question why i bother!) But anyway.. there are a lot of things that parrallel poker and trading - expected value, risk v reward or pot odds v implied odds etc etc...
Anyway, a lot of these basic maths issues can be brought over to trading. After all, if you have an expected value of each trade of 51%... 50 being break even, and everything above is value over time is a profit, and everything below 50 being a losing value... well, you have a winner on your hands.
This is where my new strategy (that is now going into forward testing) brings some of these elements together.
The strategy itself is very very easy, and i am happy to share it here... however, what i want to share, is the trade plan and money management that goes with it, as this is where i firmly believe makes it a winner or a loser over the long term - Expected Value (or EV for short)
There is a lot of terminology that gets thrown about for the fist bit - and that is Support and resistance lines/Supply and Demand, PRZ, Random market movements, astrological alignment, Fib retracements etc etc... It doesn't matter what you believe, but these are places where we can expect price to go in the other direction.
I am coming from a point of supply and demand, and that is how i will describe it.
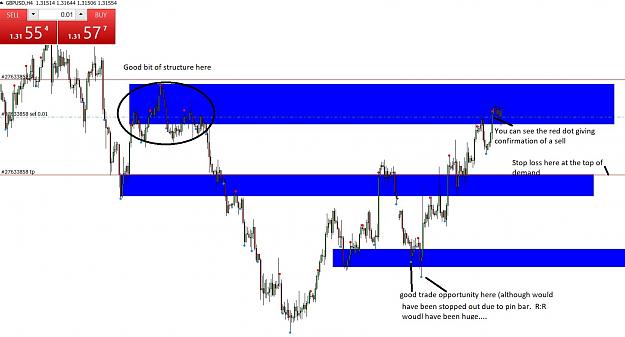
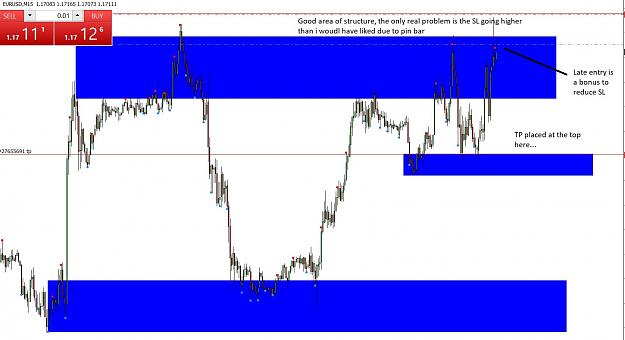
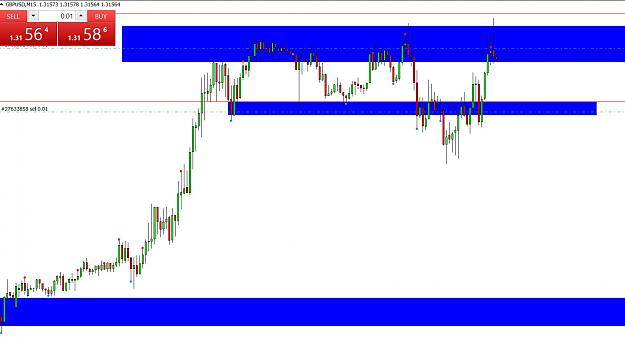
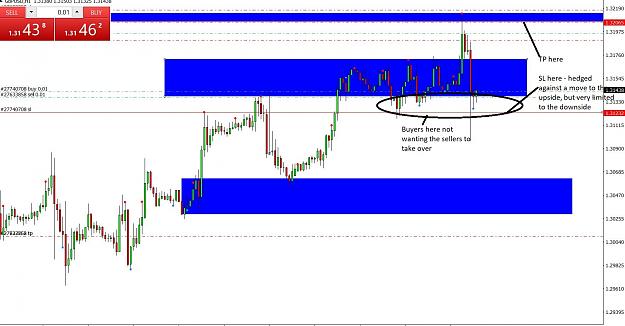
We are looking to draw rectangles on the chart where buyers and sellers accumulate... so you should have a rectangle at the top of price, and a rectangle at the bottom of price. We are looking for where the buyers and sellers move the market. Where price is bouncing about with no clear movement - we are not concerned about these.
The easy way to find these places - is to simply zoom out as far as you can go and see where the price moves happen over time... it shoudl be pretty clear. If there is uncertainty, then you have not got the right areas.
I have one indicator on the chart.. it is called trend reversal points... and it is only represented on the chart with either a blue or a red dot.
That is it for the visual element.
What makes a successful system?
One that never loses... if you believe that, then skip along to the next system.
A successful system, in my opinion (which is key here) is one which has a healthy amount of winners in relation to losers.
What does this mean?? It depends on the system.
A system that has 1% of winners, but has a risk reward ratio of 100:101… ie you might win 99 out of 100 trades, but you only risk 1 pip and gain 101 pips over 100 trades, will be winner… don’t get me wrong, I don’t think my tolerance could cope… but I know that some people could… but what a terrible way to live!!!
A system that wins 99 trades out of 100, but every 100 trades you lose 101 pips risking 1 pip each trade, is going to be a loser over time.
S what we need is to create a strategy that by percentage, wins more than the risk reward… so, if we win 50% of the time, risking more than 1:1 risk to reward, we are going to be on to a winner.
Our EV over time will have us winning.
Something to point out here, is that the law of big numbers means that for the first 150 trades, they could all be losers… that is the nature of things.. it does not mean to say that it will be a loser over 1000 trades.
In a nutshell…. Ultimately we are looking for profitable pips… sorry, scratch that… we are looking for profit… green cash…
So to recap…
We need a system that will profit long term (hence the forward test on demo only)
We have a simple strategy:
Supply demand areas, that will serve as entry and exit points
We need a confirmation indicator to say that we have a 50% chance or more that we are going to win the trade.
Our trading plan:
The most overlooked point of any strategy… people think that If you have a winning strategy, then it needs to just be set and forget… that is SOOO wrong.
You need clear definitions for WHY you are entering the trade. You can call it whatever you like – structure, harmonics, abcd, 1:1, fib retracement/projection… pretty much everything rolls up to a decision to either enter or not… to exit or not.
I have done the thinking in regards to this and the rules of my game are as follows:
Draw in relevant supply and demand areas. What do I mean by relevant? The places where decisions are made. You may have heard of the elastic band theory – It is very relevant in band strategies – so bolinger bands for instance – price will always return to the mid line, like an elastic band… it doesn’t matter how far away it gets... price will always return to the centre line and bounce or cross it…
That is great in theory, but does not really help, as we have no idea when that would be (or rather I cant see a correlation that I can take advantage of)
However, what I DO know, is that with an alarming percentage of the time, price will always retreat to the supply demand areas. Open any chart, and you will see this. It may take a long time but the good thing for us, is that the area NEVER changes. That makes it predicatable. And no I am not saying that you leave positions open, because I said that price would always get back there, I am saying that a large percentage of the time, you will be right.
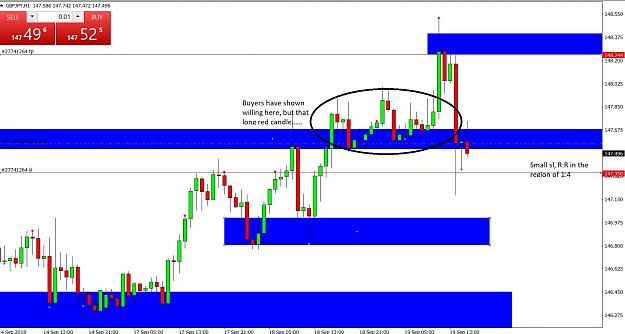
What is even better, is that once you get good at drawing in these supply and demand zones, you will start getting trades that will have a big R:R – anywhere from 1:1 to 1:10. Looking at the back testing, the average R:R is along the lines of 1:2 to 1:3. What does this equate to? For every pip, you get 2 or 3 back… so for a trade with a SL of 50, you could be looking at 100-200 pips profit.
That is super!
There is an even greater plus point to this though. If you get good at these levels, they are self fulfilling Stop loss zones. If you are expecting sellers to come in, there are places predefined in the market that the buyers will win the battle. From there, it is likely that we are in a breakout which we have just avoided. The even BETTER point, is that your stop loss will reduce the beter you get at drawing these in… I hope to show you how these can improve over time by posting my trades.
This stuff is not complicated, and the more complicated the system, the more likely it is to fail in the hands of a less than competent trader. This is what I am looking to avoid. Simple rules. Simple entries. Simple exits.
Waffling on… The entry rules themselves are easy.
Once price reaches the Supply demand zone, we are on alert. Once the trend reversal point jumps in (non repainting by the way) we enter on the opening of the next candle.
Simple.
We then open up further positions if we get further reversal signs. The maximum I have seen is 3 in one ‘trade’. Why is this a good idea? Surely this is crazy?
What generally happens is that the buyers are coming in at the demand zone… the price shoots up, and then price starts to break down once we get to the supply zone. The sellers start coming in. we get our first signal… Price drops a little bit, but the buyers are still not done… so price goes a little bit higher (but still in our zone) the sellers stand there like Gandalf ‘You will not pass’… the buyers run a little bit scared… before the Balrog regroups… and price goes a tiny bit higher again ‘YOU SHALL NOT PASS’… queue the sellers coming in with a big bright light, and the price falls away… risk to reward is increased (better entry price) and we still have a low stop loss, but our upside has just doubled… and then tripled. What is even better the more that we get these signals, the more the battle will be won… think of a double top… the more a level is tested and rejected, the more likely the ‘pushers’ will run out of energy. Not always… but more likely… we have a greater EV.
The opposite is also true.
Despite what I said above, I prefer the approach of setting a set stop loss, and set take profit. These are set in stone with the exception of the trade management rules.
Trade management rules:
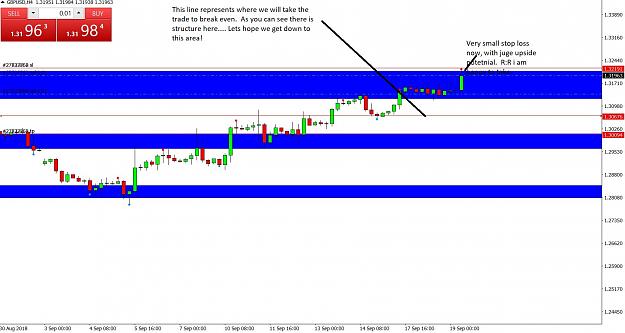
Once we hit 50% profit, the SL moves to +1 pip on a 15 min chart, +3 on a 1 hour chart and +5 pips on a 4 hour chart– we then get a guaranteed winner, and we do not have to panic about losing our full stop loss.
Once we are almost at full take profit, we can move the TP level to 50% of the trade.
At this point, the issue of losing all those green pips when you were 1 pip away is just not nice. I would rather take 100 pips than take the risk 95 pips... because we did not manage the trade.
Exit rules
This is more where to place your Take profit… I have thought long and hard about this, and it all depends what your tolerance is for risk and what you believe the actual reward is.
My exit is simple on a buy trade, you place TP at the BOTTOM of the rectangle of your supply level and vice versa for a sell trade.
You may be missing some of the move, but it is a safety zone. Why chase a couple of extra pips when it only represents a small portion of the trade. Eeking out those 1 or 2 pips will ultimately cause far too much grief in my opinion.
You may think that trailing above 50% Is better for your tolerance, but not for me. As I say, it is wings and roundabouts, but the reasons and rationale listed above should hopefully be clear as to why I want to trade in this way?
Bank management:
How do you approach your bank manager with all those dollars?
This is the least often reported part of forex, because so many people never make it to this stage.
Fair enough, Bank management is NOT that. It is a case of Bankroll management.
I have a preferred Bank roll management plan which I will share at a different date. This is a demo of the strategy, not the BR management side.
What Charts to trade on?
Any.
Yes, there are choppier charts… yes there are things that happen that affect your trades, yes you can mitigate these, but at the same time, it all depends on your tolerance for volatility.
I am testing on the 15 min, 1hour and 4 hour charts. The percentage of winners (as I say in back testing!) is fairly consistent across all timeframes.
What pairs? Any. Who gives a money’s uncle about what pairs… supply/demand is always consistent… it is down to you as a trader to read the charts, and what level of volatility you can withstand and trade profitably.
How many pairs to trade? Who cares? It is down to you as a trader and your tolerance.
I am currently looking at the EURUSD, USDCAD and GBPUSD. Why? Because these are the charts I like to trade on, with USDCAD being my favourite… why? Because who knows why? Is it really any of your business, and will it affect your trading decisions? Nope!
One thing I will say, is that the 1 hour and 4 hour charts will be traded all week, and the 15 mins chart will be traded only on a Thursday and Friday – as this is when I have the ability to trade these time frames. I want to get the number of trades in, as volume = reliability.
That is it basically….
Recap and summary:
Supply/Demand areas (S/D)
Trend reversal points (TRP)
Price Reversal Zone (PRZ)
1. Draw in S/D levels
2. Price gets to Supply/Demand area it becomes a PRZ
3. When in the PRZ and TRP is triggered, we take a position. We take as many positions as we get signals for in the zone until we get stopped out, or price moves in our favour.
4. SL is place outside of the S/D level
5. TP is placed at the start of the opposite rectangle
6. Trade moved to B/E when price reached 50% to take profit
7. Trade moved to 50% profit when within a pip or two of TP level (adjusted for timeframe)
That is it… basically…
TE started to keep track.
in the meantime - i have been doing a LOT of thinking... and actually playing A LOT MORE poker... (and yes i am winning, but have hit a downswing which make me question why i bother!) But anyway.. there are a lot of things that parrallel poker and trading - expected value, risk v reward or pot odds v implied odds etc etc...
Anyway, a lot of these basic maths issues can be brought over to trading. After all, if you have an expected value of each trade of 51%... 50 being break even, and everything above is value over time is a profit, and everything below 50 being a losing value... well, you have a winner on your hands.
This is where my new strategy (that is now going into forward testing) brings some of these elements together.
The strategy itself is very very easy, and i am happy to share it here... however, what i want to share, is the trade plan and money management that goes with it, as this is where i firmly believe makes it a winner or a loser over the long term - Expected Value (or EV for short)
There is a lot of terminology that gets thrown about for the fist bit - and that is Support and resistance lines/Supply and Demand, PRZ, Random market movements, astrological alignment, Fib retracements etc etc... It doesn't matter what you believe, but these are places where we can expect price to go in the other direction.
I am coming from a point of supply and demand, and that is how i will describe it.
We are looking to draw rectangles on the chart where buyers and sellers accumulate... so you should have a rectangle at the top of price, and a rectangle at the bottom of price. We are looking for where the buyers and sellers move the market. Where price is bouncing about with no clear movement - we are not concerned about these.
The easy way to find these places - is to simply zoom out as far as you can go and see where the price moves happen over time... it shoudl be pretty clear. If there is uncertainty, then you have not got the right areas.
I have one indicator on the chart.. it is called trend reversal points... and it is only represented on the chart with either a blue or a red dot.
That is it for the visual element.
What makes a successful system?
One that never loses... if you believe that, then skip along to the next system.
A successful system, in my opinion (which is key here) is one which has a healthy amount of winners in relation to losers.
What does this mean?? It depends on the system.
A system that has 1% of winners, but has a risk reward ratio of 100:101… ie you might win 99 out of 100 trades, but you only risk 1 pip and gain 101 pips over 100 trades, will be winner… don’t get me wrong, I don’t think my tolerance could cope… but I know that some people could… but what a terrible way to live!!!
A system that wins 99 trades out of 100, but every 100 trades you lose 101 pips risking 1 pip each trade, is going to be a loser over time.
S what we need is to create a strategy that by percentage, wins more than the risk reward… so, if we win 50% of the time, risking more than 1:1 risk to reward, we are going to be on to a winner.
Our EV over time will have us winning.
Something to point out here, is that the law of big numbers means that for the first 150 trades, they could all be losers… that is the nature of things.. it does not mean to say that it will be a loser over 1000 trades.
In a nutshell…. Ultimately we are looking for profitable pips… sorry, scratch that… we are looking for profit… green cash…
So to recap…
We need a system that will profit long term (hence the forward test on demo only)
We have a simple strategy:
Supply demand areas, that will serve as entry and exit points
We need a confirmation indicator to say that we have a 50% chance or more that we are going to win the trade.
Our trading plan:
The most overlooked point of any strategy… people think that If you have a winning strategy, then it needs to just be set and forget… that is SOOO wrong.
You need clear definitions for WHY you are entering the trade. You can call it whatever you like – structure, harmonics, abcd, 1:1, fib retracement/projection… pretty much everything rolls up to a decision to either enter or not… to exit or not.
I have done the thinking in regards to this and the rules of my game are as follows:
Draw in relevant supply and demand areas. What do I mean by relevant? The places where decisions are made. You may have heard of the elastic band theory – It is very relevant in band strategies – so bolinger bands for instance – price will always return to the mid line, like an elastic band… it doesn’t matter how far away it gets... price will always return to the centre line and bounce or cross it…
That is great in theory, but does not really help, as we have no idea when that would be (or rather I cant see a correlation that I can take advantage of)
However, what I DO know, is that with an alarming percentage of the time, price will always retreat to the supply demand areas. Open any chart, and you will see this. It may take a long time but the good thing for us, is that the area NEVER changes. That makes it predicatable. And no I am not saying that you leave positions open, because I said that price would always get back there, I am saying that a large percentage of the time, you will be right.
What is even better, is that once you get good at drawing in these supply and demand zones, you will start getting trades that will have a big R:R – anywhere from 1:1 to 1:10. Looking at the back testing, the average R:R is along the lines of 1:2 to 1:3. What does this equate to? For every pip, you get 2 or 3 back… so for a trade with a SL of 50, you could be looking at 100-200 pips profit.
That is super!
There is an even greater plus point to this though. If you get good at these levels, they are self fulfilling Stop loss zones. If you are expecting sellers to come in, there are places predefined in the market that the buyers will win the battle. From there, it is likely that we are in a breakout which we have just avoided. The even BETTER point, is that your stop loss will reduce the beter you get at drawing these in… I hope to show you how these can improve over time by posting my trades.
This stuff is not complicated, and the more complicated the system, the more likely it is to fail in the hands of a less than competent trader. This is what I am looking to avoid. Simple rules. Simple entries. Simple exits.
Waffling on… The entry rules themselves are easy.
Once price reaches the Supply demand zone, we are on alert. Once the trend reversal point jumps in (non repainting by the way) we enter on the opening of the next candle.
Simple.
We then open up further positions if we get further reversal signs. The maximum I have seen is 3 in one ‘trade’. Why is this a good idea? Surely this is crazy?
What generally happens is that the buyers are coming in at the demand zone… the price shoots up, and then price starts to break down once we get to the supply zone. The sellers start coming in. we get our first signal… Price drops a little bit, but the buyers are still not done… so price goes a little bit higher (but still in our zone) the sellers stand there like Gandalf ‘You will not pass’… the buyers run a little bit scared… before the Balrog regroups… and price goes a tiny bit higher again ‘YOU SHALL NOT PASS’… queue the sellers coming in with a big bright light, and the price falls away… risk to reward is increased (better entry price) and we still have a low stop loss, but our upside has just doubled… and then tripled. What is even better the more that we get these signals, the more the battle will be won… think of a double top… the more a level is tested and rejected, the more likely the ‘pushers’ will run out of energy. Not always… but more likely… we have a greater EV.
The opposite is also true.
Despite what I said above, I prefer the approach of setting a set stop loss, and set take profit. These are set in stone with the exception of the trade management rules.
Trade management rules:
Once we hit 50% profit, the SL moves to +1 pip on a 15 min chart, +3 on a 1 hour chart and +5 pips on a 4 hour chart– we then get a guaranteed winner, and we do not have to panic about losing our full stop loss.
Once we are almost at full take profit, we can move the TP level to 50% of the trade.
At this point, the issue of losing all those green pips when you were 1 pip away is just not nice. I would rather take 100 pips than take the risk 95 pips... because we did not manage the trade.
Exit rules
This is more where to place your Take profit… I have thought long and hard about this, and it all depends what your tolerance is for risk and what you believe the actual reward is.
My exit is simple on a buy trade, you place TP at the BOTTOM of the rectangle of your supply level and vice versa for a sell trade.
You may be missing some of the move, but it is a safety zone. Why chase a couple of extra pips when it only represents a small portion of the trade. Eeking out those 1 or 2 pips will ultimately cause far too much grief in my opinion.
You may think that trailing above 50% Is better for your tolerance, but not for me. As I say, it is wings and roundabouts, but the reasons and rationale listed above should hopefully be clear as to why I want to trade in this way?
Bank management:
How do you approach your bank manager with all those dollars?
This is the least often reported part of forex, because so many people never make it to this stage.
Fair enough, Bank management is NOT that. It is a case of Bankroll management.
I have a preferred Bank roll management plan which I will share at a different date. This is a demo of the strategy, not the BR management side.
What Charts to trade on?
Any.
Yes, there are choppier charts… yes there are things that happen that affect your trades, yes you can mitigate these, but at the same time, it all depends on your tolerance for volatility.
I am testing on the 15 min, 1hour and 4 hour charts. The percentage of winners (as I say in back testing!) is fairly consistent across all timeframes.
What pairs? Any. Who gives a money’s uncle about what pairs… supply/demand is always consistent… it is down to you as a trader to read the charts, and what level of volatility you can withstand and trade profitably.
How many pairs to trade? Who cares? It is down to you as a trader and your tolerance.
I am currently looking at the EURUSD, USDCAD and GBPUSD. Why? Because these are the charts I like to trade on, with USDCAD being my favourite… why? Because who knows why? Is it really any of your business, and will it affect your trading decisions? Nope!
One thing I will say, is that the 1 hour and 4 hour charts will be traded all week, and the 15 mins chart will be traded only on a Thursday and Friday – as this is when I have the ability to trade these time frames. I want to get the number of trades in, as volume = reliability.
That is it basically….
Recap and summary:
Supply/Demand areas (S/D)
Trend reversal points (TRP)
Price Reversal Zone (PRZ)
1. Draw in S/D levels
2. Price gets to Supply/Demand area it becomes a PRZ
3. When in the PRZ and TRP is triggered, we take a position. We take as many positions as we get signals for in the zone until we get stopped out, or price moves in our favour.
4. SL is place outside of the S/D level
5. TP is placed at the start of the opposite rectangle
6. Trade moved to B/E when price reached 50% to take profit
7. Trade moved to 50% profit when within a pip or two of TP level (adjusted for timeframe)
That is it… basically…
TE started to keep track.