Hi Guys
So Ive been working on this updated version for a long time now. This is still a beta version atm.
I invite you all to try it out.
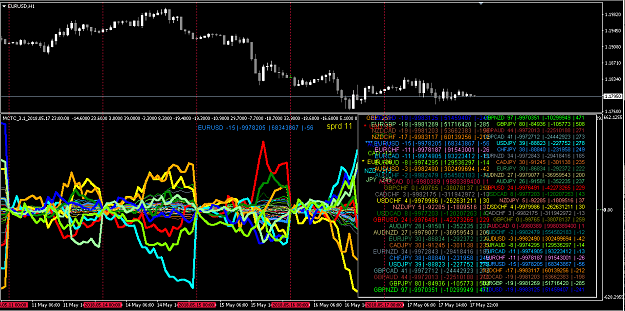
As you all know I like to trade on visual plot lines and currency strengths in real time , NO moving averages or manipulation of data , just pure price movement.
Hence this indicator was born out of that idea over a year ago.
I will update as when I can , but here is the the basics for now.
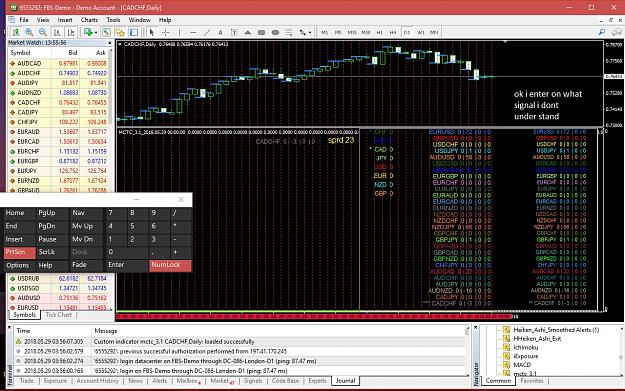
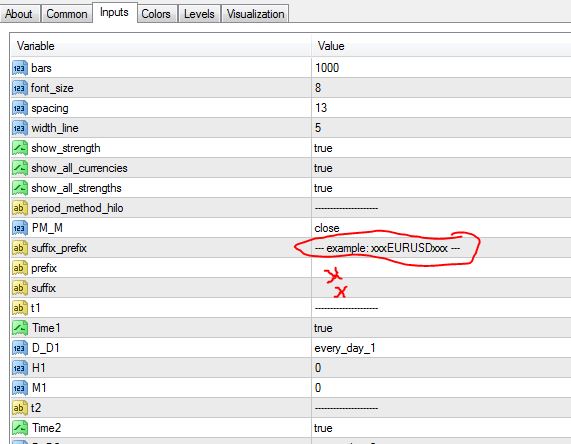
Update: updated version , now with prefix and suffix support, and some internal fixes , so should work with all brokers now , and on any chart.
------------------------------------------------
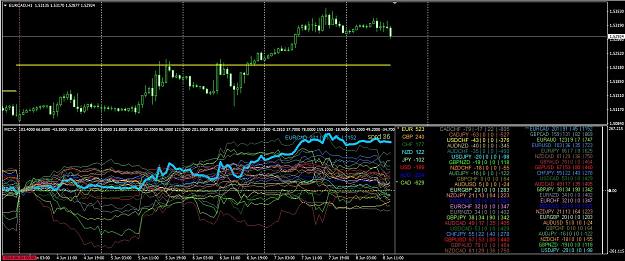
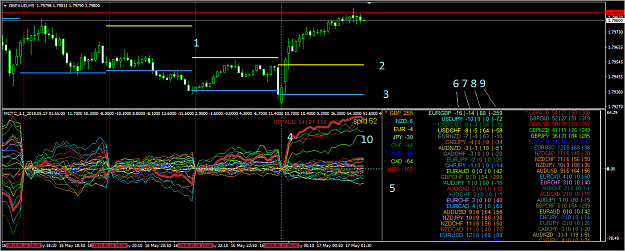
1. Time1,Time2,Time3...Time12.
The time setting that resets all values. This resets all currencies and
strengths to zero and will start measuring until the next time setting.
This is usefull to start measuring the progress of currencies for example a
news release or trading session , example London open to London close.
2 and 3. PM_M setting in inputs. The high and low of the start to end of the
previous Time settings.
This can be set to either absolute higest/lowest or highest/lowest of close
of bar.
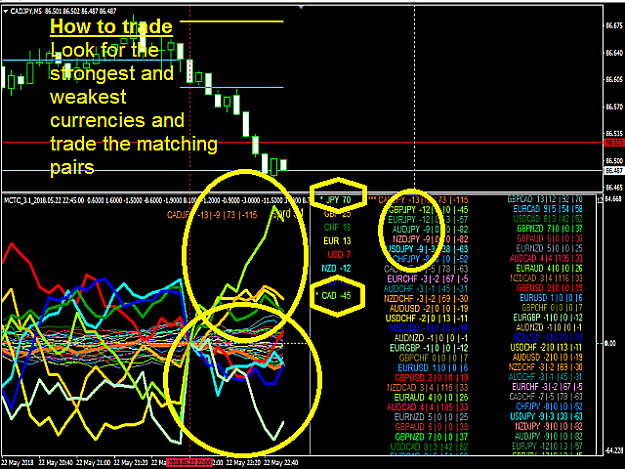
4. Higlighted line of the current Chart Pair.
5. The strength of each individual currency within the settings of no.1
above
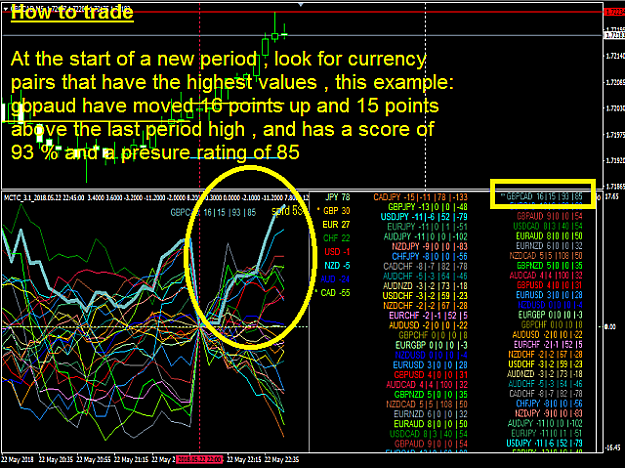
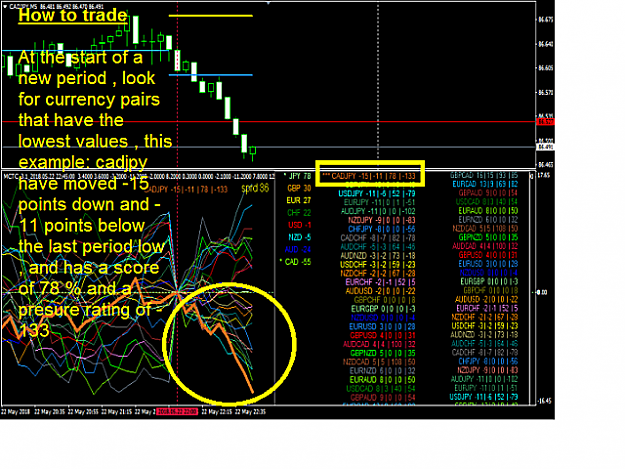
6. The number of points the the currency pair has moved within the settings
of no.1 above.
7.The number of points that the currency pair has moved above or below the
high/low lines as defined in no.2
8. The percentage of the movement as calculated from no.6 and no.7.
9. This is the absolute strength (presure) as calculated from no.5.
example EURUSD: EUR= -4 and USD= -102 , the result is -98.
10. spead: current spread of the Chart pair.
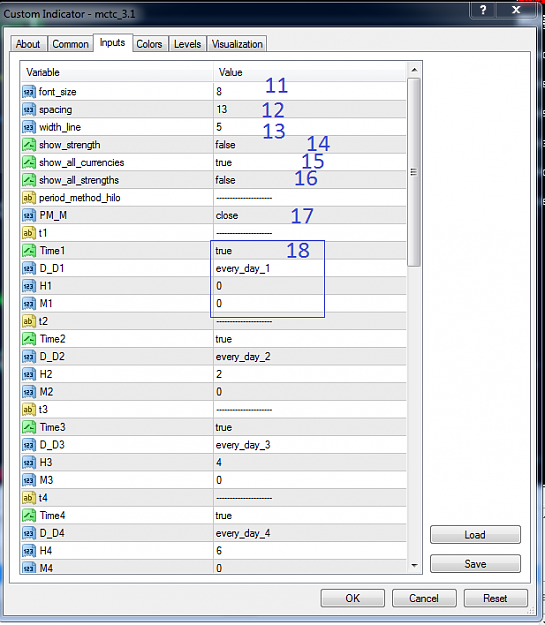
11. font size for the side meter
12. spacing for the side meter
13. line width of the highlighted chart currency.
14. show_Strenth: This will plot strength lines ONLY for the chart pair ,
set to true/false.
15. show_all_currencies:
This will plot the lines of all the currency pairs
, set to true/false
16. show_all_strengths: This will plot strength lines for each currency ,
see no.5
17. PM_M: Choose highest/lowest at close of bar ,or, absolute highest/lowest
within the settings of no.1 above.
18. Sets the reset times, see no.1 . There are 12 reset times that can be
used from day/hour/minute.
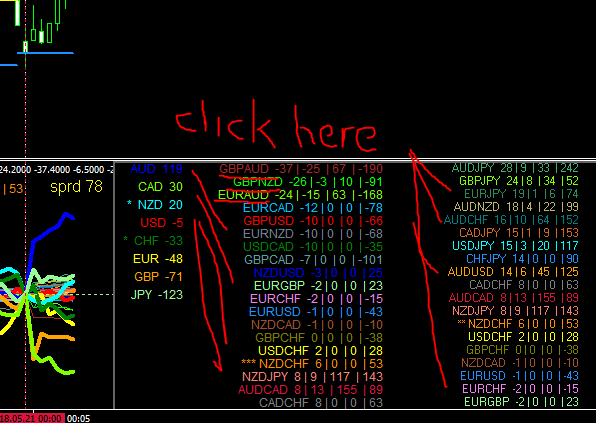
clickable chart:
Click on the currency pair in the side meter to change to that pair.
So Ive been working on this updated version for a long time now. This is still a beta version atm.
I invite you all to try it out.
As you all know I like to trade on visual plot lines and currency strengths in real time , NO moving averages or manipulation of data , just pure price movement.
Hence this indicator was born out of that idea over a year ago.
I will update as when I can , but here is the the basics for now.
Update: updated version , now with prefix and suffix support, and some internal fixes , so should work with all brokers now , and on any chart.
------------------------------------------------
1. Time1,Time2,Time3...Time12.
The time setting that resets all values. This resets all currencies and
strengths to zero and will start measuring until the next time setting.
This is usefull to start measuring the progress of currencies for example a
news release or trading session , example London open to London close.
2 and 3. PM_M setting in inputs. The high and low of the start to end of the
previous Time settings.
This can be set to either absolute higest/lowest or highest/lowest of close
of bar.
4. Higlighted line of the current Chart Pair.
5. The strength of each individual currency within the settings of no.1
above
6. The number of points the the currency pair has moved within the settings
of no.1 above.
7.The number of points that the currency pair has moved above or below the
high/low lines as defined in no.2
8. The percentage of the movement as calculated from no.6 and no.7.
9. This is the absolute strength (presure) as calculated from no.5.
example EURUSD: EUR= -4 and USD= -102 , the result is -98.
10. spead: current spread of the Chart pair.
11. font size for the side meter
12. spacing for the side meter
13. line width of the highlighted chart currency.
14. show_Strenth: This will plot strength lines ONLY for the chart pair ,
set to true/false.
15. show_all_currencies:
This will plot the lines of all the currency pairs
, set to true/false
16. show_all_strengths: This will plot strength lines for each currency ,
see no.5
17. PM_M: Choose highest/lowest at close of bar ,or, absolute highest/lowest
within the settings of no.1 above.
18. Sets the reset times, see no.1 . There are 12 reset times that can be
used from day/hour/minute.
clickable chart:
Click on the currency pair in the side meter to change to that pair.
Attached Image(s) (click to enlarge)
Attached File(s)