Hello guys.
One simple question. What do you think of multiple divergence that are shaping after one another? How would I know which one is the last one?
Here's the situation. I see a clear divergence in a bullish trend (higher high in the trend while lower high in an Oscillator). I then decide to go short on this, using other confirmation tools like candlestick patterns and fibo ret, etc. . Then the market goes on and makes a new higher high while the oscillator keeps making a lower high! I again interpret it as a new divergence and go short on this. Then the market makes a third divergence and still going up!!!
That is when I am almost 20 to 30 percent of my equity in loss and wonder if it is worth staying in these trades. Until somehow magically the divergence bubble explodes and a strong bearish trend start, reversing my loss trades into big profits.
Now some other times you could not be that lucky and end up broke because a reverse trend happens too late (or you entered too early) or that you lose hope of the divergence and exit the trades in loss impatiently. ( it burns me specially when I realize my analysis was correct and I was just a little hasty to close my trades in loss)
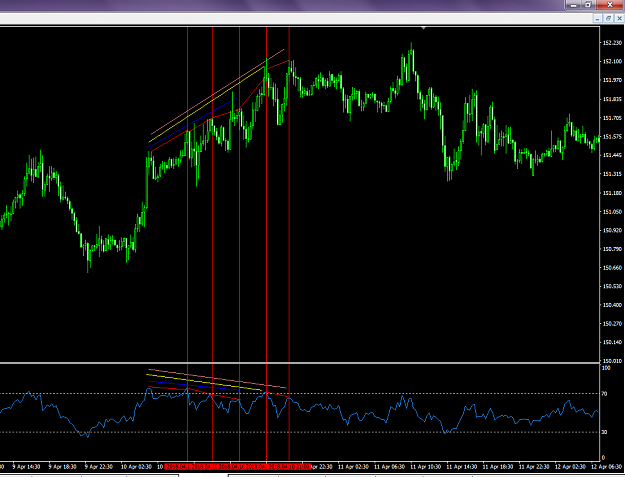
To illustrate what I mean I will show it on the chart. The first image below is the trade starts and the second image is the exit part. In the first image the vertical lines are the possible short positions that I might take. The further the trend goes and forms a new higher high, the bigger lot size I will go short. I usually start with 0.01 on the first trade and end up on 0.05 on the last, so that even if the market reverses for half of the road, I still end up profiting from this.
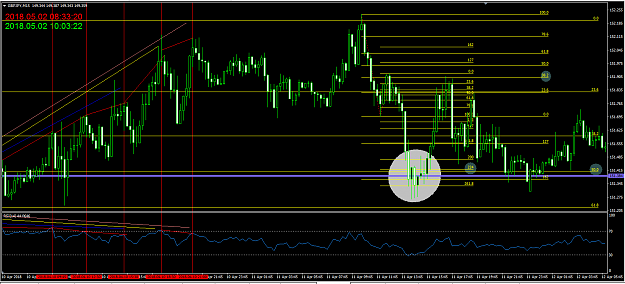
Now look at the second image for the exit point. in this example I would exit all my short positions base on the 50% resistance, since the downtrend fibo ret. shows a 38% retracement, which means a 224% extension is the first TP, all of which are almost in the same area. ( I marked them all with circles and my exit point is in white circle to clarify them for you)
The first trade is in 50 to 100 pips profit, while the last one (with bigger lot size) is in +600 pips profit. This is a typical example.
I know this is a solid strategy. The only problem is when will I know the actual trend stops making a new divergence and actually start to reverse.
Any ideas?
One simple question. What do you think of multiple divergence that are shaping after one another? How would I know which one is the last one?
Here's the situation. I see a clear divergence in a bullish trend (higher high in the trend while lower high in an Oscillator). I then decide to go short on this, using other confirmation tools like candlestick patterns and fibo ret, etc. . Then the market goes on and makes a new higher high while the oscillator keeps making a lower high! I again interpret it as a new divergence and go short on this. Then the market makes a third divergence and still going up!!!
That is when I am almost 20 to 30 percent of my equity in loss and wonder if it is worth staying in these trades. Until somehow magically the divergence bubble explodes and a strong bearish trend start, reversing my loss trades into big profits.
Now some other times you could not be that lucky and end up broke because a reverse trend happens too late (or you entered too early) or that you lose hope of the divergence and exit the trades in loss impatiently. ( it burns me specially when I realize my analysis was correct and I was just a little hasty to close my trades in loss)
To illustrate what I mean I will show it on the chart. The first image below is the trade starts and the second image is the exit part. In the first image the vertical lines are the possible short positions that I might take. The further the trend goes and forms a new higher high, the bigger lot size I will go short. I usually start with 0.01 on the first trade and end up on 0.05 on the last, so that even if the market reverses for half of the road, I still end up profiting from this.
Now look at the second image for the exit point. in this example I would exit all my short positions base on the 50% resistance, since the downtrend fibo ret. shows a 38% retracement, which means a 224% extension is the first TP, all of which are almost in the same area. ( I marked them all with circles and my exit point is in white circle to clarify them for you)
The first trade is in 50 to 100 pips profit, while the last one (with bigger lot size) is in +600 pips profit. This is a typical example.
I know this is a solid strategy. The only problem is when will I know the actual trend stops making a new divergence and actually start to reverse.
Any ideas?
Attached Image(s) (click to enlarge)