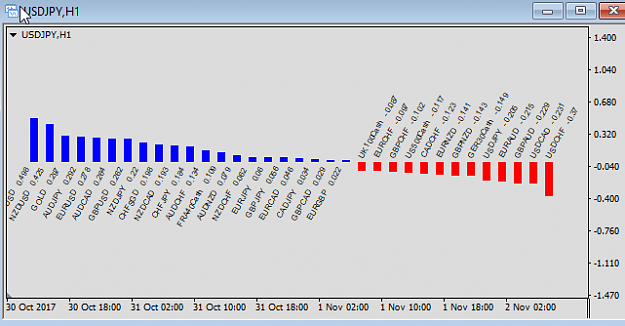
Presenting all market watch symbols in bar charts (% growth daily)
plus some other functions
I want to get the % growth of all symbols in Market Watch presented in bar-objectives,
sorted from most + to most - .
The timeframe can be selected by the user, from 1 min. to 1 month (whereas 1 day shall be default).
The indicator should offer the following functions:
a) Sort out and represent only symbols with a certain value
for ex. all that go above 0,22 %
b) represent symbols between two values (for ex. 0,23 % and 1,2 %)
Furthermore it should have one/two alarms, for every symbol that goes above a value.
Coding this even as a heatmap is an asset, but no must (if so, we can speak about the price again).
Thanks
EDIT: Big variety of symbols. 16 or may even 24 fit into one chart-window; what about the rest?!
You cannot scroll in a chart-window as far as I know. So might be the solution in opening the indicator in an own window?
https://www.mql5.com/en/job/69933/
Check page 1 for all infos...