This is a strategy that I have been developing for some time now and has proven to be very consistent with great risk/reward opportunities if done properly. This strategy works best during London and US open but can be used during the Aussie session and Tokyo with smaller profit targets and stop losses. I use mainly the 15 minute chart and the 1 hour chart is used to double check trades or to take a longer term trade. Take profit and stop loss will vary upon the trade but do not take a trade unless you have at least a 1:1 risk/reward. I typically take a 1:2 risk/reward or higher. With all 4 signals lining up you can be more aggressive with the target profit. I will keep my trade explorer visible as I continue to test this strategy. Any constructive input is appreciated.
You will need a platform that has these indicators and these settings:
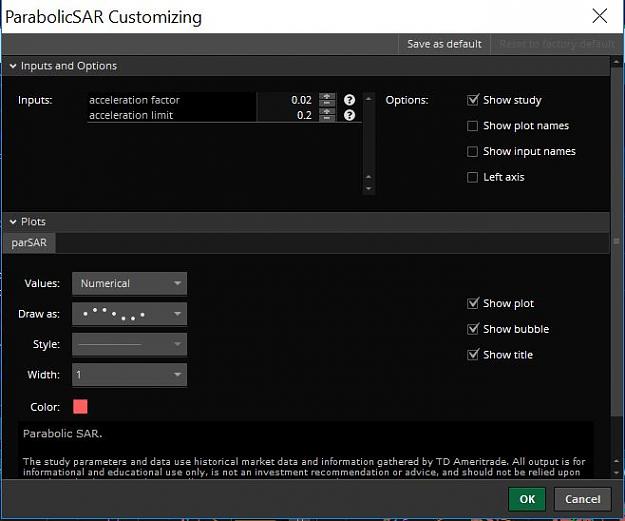
Parabolic SAR (Red Dots)
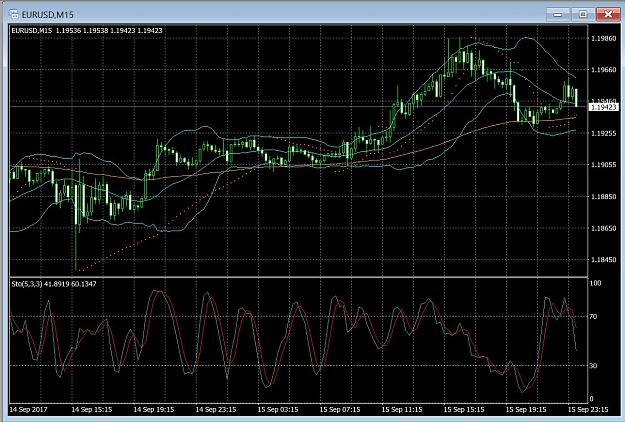
Stochastic Full w/ 70 High 30 Low 5 K Period 3 D Period (Red/Blue lines at bottom of screen)
100 EMA (Orange Line)
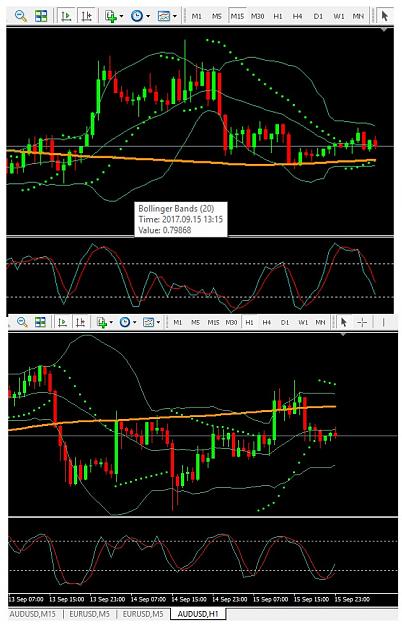
Bollinger Bands (Blue lines on chart)
As far as the order of significance to the strategy, I look for the signals in this order:
100 EMA
Stochastic Full
Parabolic SAR
Bollinger Bands
The idea is to have at least 3/4 indicators have correct signals to open the trade. This should happen a few times during the day depending upon how many pairs you are watching. Trades with 4/4 indicators will always have the best risk/reward.
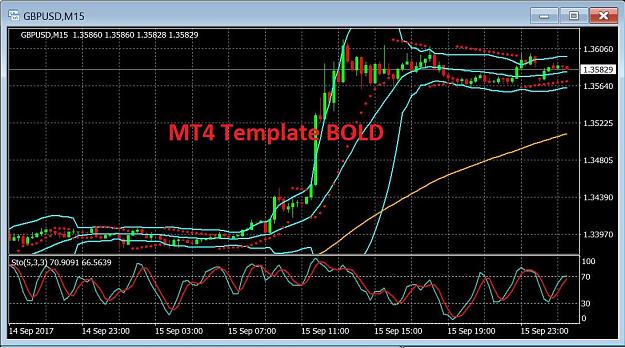
EDIT: I have now attached a Template for this strategy for MT4 to be as user friendly as possible. There is also now a BOLD template for better visuals for lower resolution monitors or higher visibility.
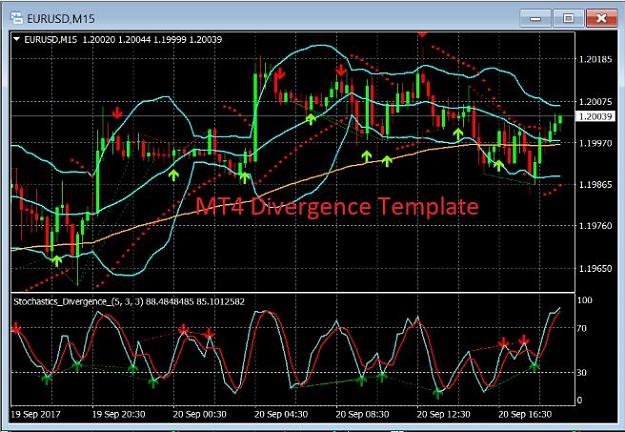
Here is another template for the divergence indicators as provided by AngelicaMari.
These are examples of the strategy:
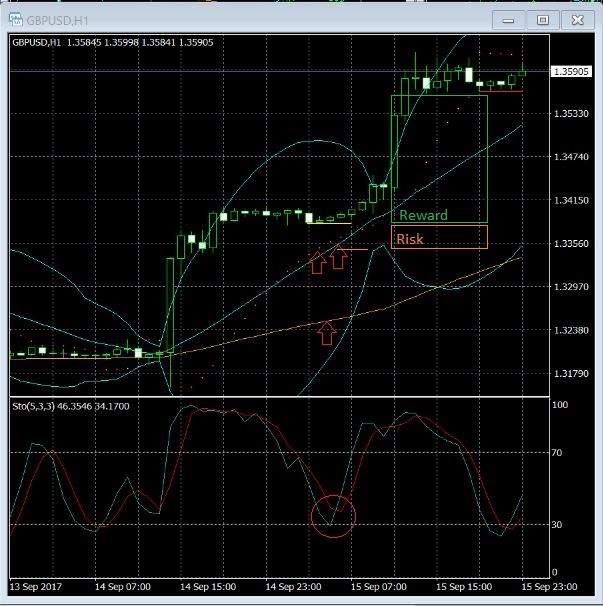
First picture is GBP/USD 1 hour chart. All 4 signals are lining up here with a bullish divergence. Price is above 100 EMA, the Parabolic SAR, and middle bollinger band. The stochastic indicator is below 30 with the price being very close to the other indicators allowing for a fantastic risk/reward.
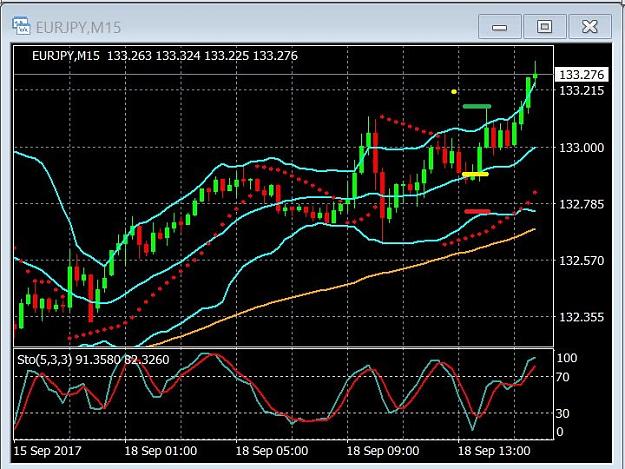
Second picture is the EUR/JPY 15 minute chart with 4/4 signals and again bullish divergence. Price is very close to the middle bollinger band with the stop loss just a few pips underneath it for a favorable risk/reward.
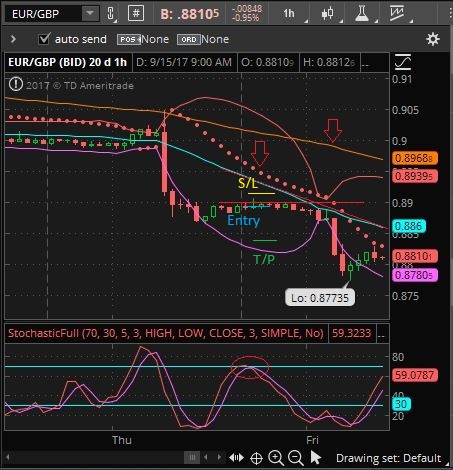
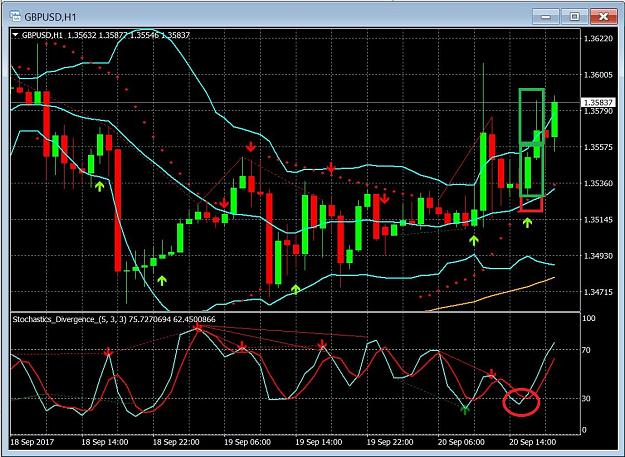
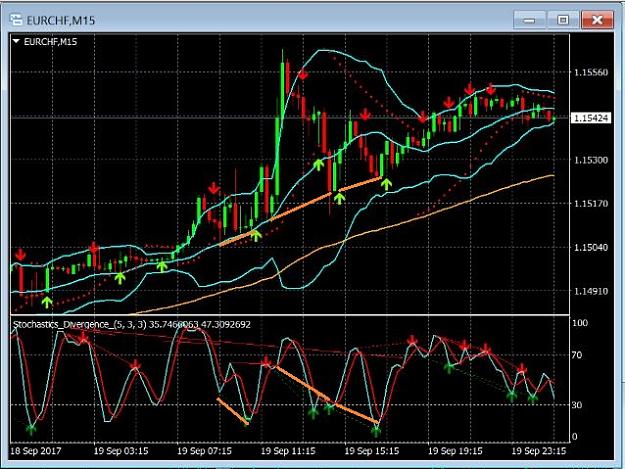
Third picture is an example of the importance of divergence with this strategy. Each orange line is a bull divergence signal and each time this occurs there is a large bullish move. The first orange line also has 4/4 signals and creates the largest move in the picture.
For more examples, there are plenty scattered through this thread.
You will need a platform that has these indicators and these settings:
Parabolic SAR (Red Dots)
Stochastic Full w/ 70 High 30 Low 5 K Period 3 D Period (Red/Blue lines at bottom of screen)
100 EMA (Orange Line)
Bollinger Bands (Blue lines on chart)
As far as the order of significance to the strategy, I look for the signals in this order:
100 EMA
Stochastic Full
Parabolic SAR
Bollinger Bands
The idea is to have at least 3/4 indicators have correct signals to open the trade. This should happen a few times during the day depending upon how many pairs you are watching. Trades with 4/4 indicators will always have the best risk/reward.
EDIT: I have now attached a Template for this strategy for MT4 to be as user friendly as possible. There is also now a BOLD template for better visuals for lower resolution monitors or higher visibility.
Here is another template for the divergence indicators as provided by AngelicaMari.
These are examples of the strategy:
First picture is GBP/USD 1 hour chart. All 4 signals are lining up here with a bullish divergence. Price is above 100 EMA, the Parabolic SAR, and middle bollinger band. The stochastic indicator is below 30 with the price being very close to the other indicators allowing for a fantastic risk/reward.
Second picture is the EUR/JPY 15 minute chart with 4/4 signals and again bullish divergence. Price is very close to the middle bollinger band with the stop loss just a few pips underneath it for a favorable risk/reward.
Third picture is an example of the importance of divergence with this strategy. Each orange line is a bull divergence signal and each time this occurs there is a large bullish move. The first orange line also has 4/4 signals and creates the largest move in the picture.
For more examples, there are plenty scattered through this thread.
Attached Image(s) (click to enlarge)
Attached File(s)