What I mean by the title is that there are 2 kinds of people....
Those who can just take a bare chart and trade with it.
Those who need to personalize it to make themselves feel at home when trading.
The first type already feels at home with the bare chart anyway. All the power to them. I used to have no need for candles and indys at a time but then again, I didn't need to look at charts anyway. But, I like eye-candy.
So, here I am looking for a base design. I have an example that I am going to share that shows a simple base design that a trader can lay any indy on and start from there. In my taste, the background should be black because white or light shades are really bright for my eyes. I recommend everyone to go dark in this regard. I don't really want the typical bright green/white candles or typical red and green because they are so distracting. Everybody to their own but I like to see the candles in the background of my indicators without being flashed the awesome surge of power they convey in quick vertical movements. The candles take the attention away from my indys...ehem..like'm indys.
If anyone else likes to contribute a design, please go ahead. You can of course throw in indicators that you think contribute to the look but not too many please. We are keeping it simple and sleek.
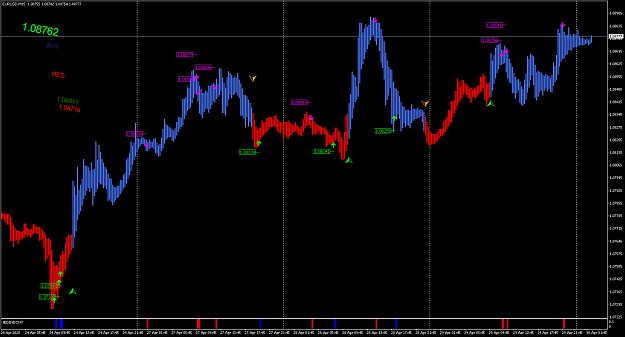
So, this particular template has 2 indicators.
1-LargeTimeFrame
2- AK_Line Chart Closes
You can still see the candles and whether they closed in green or red. Then you can lay your own fave indy on it and so on. The large time frame indy, shows you if it was a day up or down and what went on to make it a down or up day and it updates in real time so you know which way you are heading without switching charts.
Also, this helps you analyze the day at one glance. For example, on April 28th, all that the price wanted to do was go down from the open by 10 pips or so but look at the range up and down before settling down for a small decline. April 29th on the other hand so far is galloping upwards and all the down candles can easily be identified in retrospect as just retraces. It's easy to see against the green large day candle in the background.
Also shown, the same template with line or bars.
Someone try it n let me know if it looks right on their computer pls.
The template has a TMA channel thrown in so you can see whats up and what's down better. It's not shown in the images. I think that's all you need.
Those who can just take a bare chart and trade with it.
Those who need to personalize it to make themselves feel at home when trading.
The first type already feels at home with the bare chart anyway. All the power to them. I used to have no need for candles and indys at a time but then again, I didn't need to look at charts anyway. But, I like eye-candy.
So, here I am looking for a base design. I have an example that I am going to share that shows a simple base design that a trader can lay any indy on and start from there. In my taste, the background should be black because white or light shades are really bright for my eyes. I recommend everyone to go dark in this regard.
If anyone else likes to contribute a design, please go ahead. You can of course throw in indicators that you think contribute to the look but not too many please. We are keeping it simple and sleek.
So, this particular template has 2 indicators.
1-LargeTimeFrame
2- AK_Line Chart Closes
You can still see the candles and whether they closed in green or red. Then you can lay your own fave indy on it and so on. The large time frame indy, shows you if it was a day up or down and what went on to make it a down or up day and it updates in real time so you know which way you are heading without switching charts.
Also, this helps you analyze the day at one glance. For example, on April 28th, all that the price wanted to do was go down from the open by 10 pips or so but look at the range up and down before settling down for a small decline. April 29th on the other hand so far is galloping upwards and all the down candles can easily be identified in retrospect as just retraces. It's easy to see against the green large day candle in the background.
Also shown, the same template with line or bars.
Someone try it n let me know if it looks right on their computer pls.
The template has a TMA channel thrown in so you can see whats up and what's down better. It's not shown in the images. I think that's all you need.
Attached Image(s) (click to enlarge)


Attached File(s)