• Home
  • Forums
  • News
  • Calendar
  • Market
  • Login
  • Join
  • User/Email: Password:
  • 1:30pm
Menu
  • Forums
  • News
  • Calendar
  • Market
  • Login
  • Join
  • 1:30pm
Sister Sites
  • Metals Mine
  • Crypto Craft
  • Forex Factory

Options

Bookmark Thread

First Page First Unread Last Page Last Post

Print Thread

Similar Threads

Optimization, statistics, and avoidance of curve fitting 21 replies

Curve Fitting: The Ultimate Conundrum 17 replies

EA Backtesting and Curve Fitting Concern 2 replies

why curve fitting doesn't work? 23 replies

"curve fitting" or just improving?? 5 replies

  • Trading Discussion
  • /
  • Reply to Thread
  • Subscribe
  • 1
Attachments: Curve fitting vs optimization
Exit Attachments
Tags: Curve fitting vs optimization
Cancel

Curve fitting vs optimization

  • Last Post
  •  
  • Page 1 2 3
  • Page 1 2 3
  •  
  • Post #1
  • Quote
  • First Post: Dec 5, 2019 3:03pm Dec 5, 2019 3:03pm
  •  HeyYou
  • Joined Apr 2015 | Status: Member | 1,753 Posts
So guys, many people confuse curve fitting with optimization and I get pissed off when I hear things like "you are just curve fitting!" bla bla bla.. so I wanted to share my views about this interesting subject: is my model actually predictive or plain stupid ?

this question drove me nuts until I came up with an answer no it's not plain stupid...

My conclusion is that checking if a system works with different parameters (e.g. entry / exit points) is a must before proceeding with optimization.... but this is not enough, it has to work in the "future"..

SO, what I do:
-I backtest the system with different parameters from 2000 to 2014.
-I optimize the parameters
-I backtest from 2014 to 2019 to see if I get consistent results...

what do you think, share your thoughts.. just show some respect... thanks.
  • Post #2
  • Quote
  • Dec 5, 2019 5:38pm Dec 5, 2019 5:38pm
  •  EF5
  • Joined Oct 2013 | Status: Member | 880 Posts
Your process sounds exactly right to me. Testing across two different time periods is a smart approach.
Self-sufficiency is the greatest of all wealth. - Epicurus
 
3
  • Post #3
  • Quote
  • Dec 6, 2019 2:00am Dec 6, 2019 2:00am
  •  HeyYou
  • Joined Apr 2015 | Status: Member | 1,753 Posts
Quoting Ef5
Disliked
Your process sounds exactly right to me. Testing across two different time periods is a smart approach.
Ignored

yes, I'm sure it's nothing new and it's so simple... but very useful & I think few people do it .
 
1
  • Post #4
  • Quote
  • Dec 6, 2019 5:55am Dec 6, 2019 5:55am
  •  PipMeUp
  • Joined Aug 2011 | Status: Member | 1,305 Posts
There is confusion with many terms like random = unpredictible or predictive = acurate.
An example: EUR/USD will close the week between 1.0000 and 1.3000. This is a prediction and I'm extremely confident it is correct
=> my model is actually predictive *AND* plain stupid.

Quoting HeyYou
Disliked
-I backtest the system with different parameters from 2000 to 2014.
-I optimize the parameters
-I backtest from 2014 to 2019 to see if I get consistent results...
Ignored
Let's pretend that it DOES NOT get consistent (positive) results. What next?
- You backtest another system with different parameters from 2000 to 2014.
- You optimize the parameters
- You backtest from 2014 to 2019 to see if you get consistent results...

Let's pretend that it DOES NOT get consistent positive results. What next? Do this again?
If you keep doing so, the many tested systems become equivalent to a meta-system.

Let me clarify this:
You can consider testing a trend following system or a mean revertion system. You can see these two classes of systems as a meta-parameter to select. You may use stochastic or CCI or RSI or AO or <insert your preferred one> or a combination of them or an oscillator of your creation or no oscillator at all. This set of oscillators can be encoded as a vector of weights you give to each e.g. (1, 0, 0, 0, ...)=CCI only ; (0, 1, 0, 0, ...)=RSI only ; (0, 0.5, 0.5, 0, ...)=half RSI and half Awesome Osc... This vector is another meta-parameter you can optimize.
=> The system itself becomes a (meta-)parameter.

During the cycles of testing new systems you explore this space of meta-parameters (and their associated parameters). i.e. you optimize over the meta-parameters space. I mean you are now optimizing the results over 2014-2019 given the system, which is now just a parameter. The whole 2000-2019 turns into training data.

This is a very serious issue in any optimization problem. Not only about trading. The only way to escape this is to provide a huge amount of different yet relevant data. Required data size grows exponentially (literally). As an example google deep-learning image classifier was trained on tens of billions of pictures (plus many distorted variants of them)! Unfortunately we have one single history of E/U.

I had an idea that I have never had the time to try. I want to create baskets of the 7 majors weighted by random numbers. Normally if there is long term memory in the FX there is long term memory in the basket. Same for mean reversion. Impact news are there too. Everything. Optimize over this synthetic market. One new basket could be generated for each optimization iteration (computing power is the limit). The optimizer can no longer learn the dataset. You can optimize on a 2000-2019 basket and test on another 2000-2019 period.
No greed. No fear. Just maths.
 
2
  • Post #5
  • Quote
  • Dec 6, 2019 7:23am Dec 6, 2019 7:23am
  •  robots4me
  • Joined Dec 2017 | Status: Member | 4,378 Posts
@HeyYou -- I really like this topic -- thanks for creating this thread.

Quote
Disliked
I backtest the system with different parameters from 2000 to 2014
I'll be blunt -- this is a complete waste of time -- unless you have a time machine. We trade in the present -- the only data that matters is your broker's most recent data. You only need to go back in history far enough in order to simulate 50 -- 100 trades, which is your "sample size". You need a minimum sample size in order for your stats to be significant.

The data patterns from 2000 to 2014 may never occur again -- there are billions and billions of possible data patterns. There is no evidence that patterns from 2000 - 2014 will repeat in your lifetime. Furthermore, when you optimize a system using stale, historical data patterns then you cripple its performance when it encounters current data patterns. There is no single set of parameters that work great for all possible data patterns.

I think people confuse testing gobs of historical data with "teaching" their system. MT4 strategies use simple algebra -- there is no memory or learning. There is no database. There is no AI. If you optimize settings for 2015 data patterns then it will perform crappy when it encounters 2019 data patterns.

So -- what's the solution? Recalibration. Every two weeks, every month, every ???? -- you decide -- you need to recalibrate your strategy using your broker's most recent data -- not someone else's recent data -- your broker's data.

Not all strategies require recalibration -- it depends on the algorithm. Strategies that rely on timing or thresholds, are more likely to be sensitive to different settings and data patterns and, hence, require more frequent recalibration.

I suspect I'll catch some flak because recalibration is inconvenient -- but, hey, this is the way algebra works. Algebra doesn't exist for our convenience. Algebra is a tool we can use to solve problems. We adapt to it, not the other way 'round. If you don't want to recalibrate that's fine -- and then you can spend the remainder of your trading career knocking your head against a wall wondering why your strategy that used to work doesn't work any longer.
 
6
  • Post #6
  • Quote
  • Dec 6, 2019 7:43am Dec 6, 2019 7:43am
  •  RickM
  • Joined Sep 2015 | Status: Member | 2,139 Posts
Data before 2010 shows us the market was vastly different and no relationship to the present day. Data since 2015 is approx. good enough and works find between my tests, Demo trading and then Live trading.

Its all about 3 months Demo trading to confirm the specs in your trading, then do what Steve said and recalibrate every 12 months.
EA's are of course very unprecise so don't expect fantastic results. I work on the theory that a bunch of Algo's working together in a folio will smooth out the results and should produce a nice wage.

I view many EA's regularly and the best ones are small, simple and probably only have TWO external functions.
Trading thin liquidity at the boundary of the charts
 
4
  • Post #7
  • Quote
  • Edited 9:17am Dec 6, 2019 8:10am | Edited 9:17am
  •  HeyYou
  • Joined Apr 2015 | Status: Member | 1,753 Posts
Quoting PipMeUp
Disliked
The whole 2000-2019 turns into training data.
Ignored

he he he, if you believe in predictability (which is hocus pocus, I know...) you are looking for ONE parameter.. ok maybe two, one for longer term and one for short term.

if I find a system that works well from 2000 to 2014 (which is very hard btw), but doesn't work from 2014 to 2019 I discard the indicator or the set of indicators.

basically it's useful to check if the system works without forwartesting it.. which would take literally years.
 
 
  • Post #8
  • Quote
  • Edited 2:51pm Dec 6, 2019 8:34am | Edited 2:51pm
  •  zghnno
  • | Joined Feb 2015 | Status: Double the account | 239 Posts
Forget about backtesting, it does not work if you want to trade purely on the results.

Why?

In your example you tested on period 1 and then did the same test on period 2.

There's no way to know if it will work on period 1 - period x or period 2 + period y.

Anyone says anything else does not know what backtesting is used for.
Double the account
 
 
  • Post #9
  • Quote
  • Dec 6, 2019 10:37am Dec 6, 2019 10:37am
  •  PipMeUp
  • Joined Aug 2011 | Status: Member | 1,305 Posts
Quoting HeyYou
Disliked
if I find a system that works well from 2000 to 2014 (which is very hard btw), but doesn't work from 2014 to 2019 I discard the indicator or the set of indicators.
Ignored
Ok you throw it away but after? You will search for another and another and yet another until you find one that works on both periods.
Build 10000 of totally random systems. Discard all those that don't perform well over 2000-2014. How many of the remaining ones will give positive results over 2014-2019 just by chance? I would bet around ten! Yet per construction they are known to be edgeless.

What would you do with a profitable system that performs average over the period 2000-2014 but extraordinary great over 2014-2019?
No greed. No fear. Just maths.
 
1
  • Post #10
  • Quote
  • Dec 6, 2019 10:53am Dec 6, 2019 10:53am
  •  PipMeUp
  • Joined Aug 2011 | Status: Member | 1,305 Posts
Quoting robots4me
Disliked
You only need to go back in history far enough in order to simulate 50 -- 100 trades, which is your "sample size". You need a minimum sample size in order for your stats to be significant.
Ignored
If you draw samples from a normal distribution, that never changes over time, how many samples do you think you would need to estimate within ±1% error margin the mean of this distribution?
No greed. No fear. Just maths.
 
2
  • Post #11
  • Quote
  • Dec 6, 2019 11:09am Dec 6, 2019 11:09am
  •  nadiyakinare
  • Joined Dec 2014 | Status: Free Member | 363 Posts
Quoting HeyYou
Disliked
So guys, many people confuse curve fitting with optimization and I get pissed off when I hear things like "you are just curve fitting!" bla bla bla.. so I wanted to share my views about this interesting subject: is my model actually predictive or plain stupid ? this question drove me nuts until I came up with an answer no it's not plain stupid... My conclusion is that checking if a system works with different parameters (e.g. entry / exit points) is a must before proceeding with optimization.... but this is not enough, it has to work in the...
Ignored
I could answer your question and easy down your this problem but i strongly feel you should talk to copernicus (FF member) about it as he can explain you each and every details in brief better then me.
In the court of lord, only love and devotion is counted...
 
4
  • Post #12
  • Quote
  • Dec 6, 2019 11:28am Dec 6, 2019 11:28am
  •  HeyYou
  • Joined Apr 2015 | Status: Member | 1,753 Posts
Quoting nadiyakinare
Disliked
{quote} I could answer your question and easy down your this problem but i strongly feel you should talk to copernicus (FF member) about it as he can explain you each and every details in brief better then me.
Ignored
he also predicts, but he will never admit it JK
 
 
  • Post #13
  • Quote
  • Dec 6, 2019 12:06pm Dec 6, 2019 12:06pm
  •  HeyYou
  • Joined Apr 2015 | Status: Member | 1,753 Posts
btw, I would never test "random systems" ... as I said on post 1 :

" checking if a system works with different parameters (e.g. entry / exit points) is a must " and possibly on several instruments.


this does not mean they are not fallible OFC
 
 
  • Post #14
  • Quote
  • Edited 2:27pm Dec 6, 2019 12:36pm | Edited 2:27pm
  •  robots4me
  • Joined Dec 2017 | Status: Member | 4,378 Posts
Quoting PipMeUp
Disliked
{quote} If you draw samples from a normal distribution, that never changes over time, how many samples do you think you would need to estimate within ±1% error margin the mean of this distribution?
Ignored
You can't predict the future -- whether you backtest 20 years of data or the most recent 6 months. However, the *probability* of next week's data pattern being similar to last week's is much higher than it being similar to one 20 years ago.

When you back test you end up with some statistical metrics -- e.g. profit factor. In order for statistical results to be statistically significant you need a minimum sample size. A general rule of thumb in forex is 50 - 100 trades. I would prefer my sample size include recent trades (as opposed to trades from 20 years ago).

Quote
Disliked
If you draw samples from a normal distribution, that never changes over time,
You've got to be kidding. Do you trade forex? A forex trader does not trade a normal distribution -- that's trading from 30000 feet. The draw downs would wipe-out your account. A forex trader trades price action. When you look at an MT4 chart do you see a normal distribution? Of course not. We trade in real-time -- monitoring, analyzing current price data.
 
2
  • Post #15
  • Quote
  • Edited 4:12pm Dec 6, 2019 3:54pm | Edited 4:12pm
  •  auricforecas
  • Joined Sep 2017 | Status: Still a total mystery | 3,575 Posts
Quoting HeyYou
Disliked
So guys, many people confuse curve fitting with optimisation and I get pissed off when I hear things like "you are just curve fitting!" bla bla bla.. so I wanted to share my views about this interesting subject: is my model actually predictive or plain stupid ? this question drove me nuts until I came up with an answer no it's not plain stupid... My conclusion is that checking if a system works with different parameters (e.g. entry / exit points) is a must before proceeding with optimisation.... but this is not enough, it has to work in the...
Ignored
Well the thing is that sometimes it appears that way... BTW I have been predicting (FX) market for full 5months during the summer... EVERY single trade happened around it... one could get MAD MONEY out of... Or could out-perform many "industry leaders" in delivering alpha.. just by selling above, buying below.. and that with rather high leverage... could basically enter trade whenever he would feel like it... at about 25:1 and watch profits coming within those timeframe... I also gave the END date... Nailed that one also... BUT! It was even worse (at least what it appeared to many).. since it appeared as LINEAR fit.. But people have/had no idea what kind of things were happening behind the curtains, crazy calculations, through the whole 5months... It just happened to come out as "A LINE" or "LINEAR FIT". Also some serious CPU (server) power went into this... Could mine BTCs with that, just saying But the point is... the OUTCOME (although RIGHT one!) appeared the SIMPLE.. (so even "worse" than in your case) LINEAR FIT.. and people disregarded it "by default" But they LOVED chasing rats, bats and sharks in the chart... (losing a great deal of money along the way)...

My point is that if your predictions, based on heavy whatever... appear to simple.. people do not understand it or disregarded it as "fake"

But this is similar to other industries or even sports... Yokozunas (Sumo) for example.. To the untrained eye, it appears as just two "fat" guys slapping each other randomly... But inside there is HEAVY training behind it...

You know how they say... If you can't explain it simply, you don't understand it well enough. Albert Einstein
https://www.brainyquote.com/quotes/a...instein_383803

Many traders LOVE the COMPLICATED system...

The truth is in both... One has to complicate to get to simple truths.. For example e=mc2 seems retarded.. but to get there... one had to go through heaven and hell right Also, there is a search for new "one inch formula" aka theory of everything But we would have to wait EONs... At the end it would appear "too" simple to some

Just my 2b man... I feel you

BTW I was thinking that I could (over)complicate some of my system(s) in order for them to get more attention Seems some people love the "work hard"... meaning watching 100+ indicators in real time.. so they can say "I worked hard for this money" BTW+ I love the market(s) since they get 0 f... how people get there.. either going to strip clubs and find trading inspiration in the bubble gum... Or spend LIFETIME in the basement, studying EVERYTHING on trading, getting 4PHDs... bet the house.. whatever.. and still go broke... die in poverty.... This are MARKETS... NO LOGIC.. no discrimination... Just PURE simplicity

And yeah, I LOVED posting "simple" "LINE" for 5months, re-affirming it within that time, regularly... and then show the people after it was over, that the "INSIDES" or "back to the future style" ALMANAC were/was right there... And nothing It's crazy Hidden in plain sight wins every-time

Love this quote:
"And you and I can't control it, or stop it, or even slow it. Or even ever-so-slightly alter it. We just react. And we make a lot money if we get it right. And we get left by the side of the side of the road if we get it wrong. And there have always been and there always will be the same percentage of winners and losers. Happy foxes and sad sacks. Fat cats and starving dogs in this world. Yeah, there may be more of us today than there's ever been. But the percentages-they stay exactly the same." (Margin Call, 2011)

Also, GOLDen quote/clip!
Inserted Video
Can you afford to take that chance?
 
3
  • Post #16
  • Quote
  • Dec 7, 2019 4:47am Dec 7, 2019 4:47am
  •  auricforecas
  • Joined Sep 2017 | Status: Still a total mystery | 3,575 Posts
Quoting PipMeUp
Disliked
{quote} If you draw samples from a normal distribution, that never changes over time, how many samples do you think you would need to estimate within ±1% error margin the mean of this distribution?
Ignored
You seems to have some background/idea about math-stat Here are my predictions... Do you think they were just luck/random?

Many predictions vs actual... many timestamped in advance... Check here... This is the 5-month aftermath I was talking about.. (you can find more links in the quotes above, all chain of them from quote to quote) Full 5-month aftermath with all the links, quotes, timestamps... here It seems like "simple linear fit..." but it was predicted before all the FED/ECB/TWEETs

This type of predictions are my favourite (the model predicts upcoming pattern/decline - not rarely with the SLOPE degree accuracy.. although delayed):
before vs after... and many more of those... if you check my "images" or the thread I gave... BTW haven't seen anyone (else) using SLOPE (angle of the predicted "line"), but I use it to check the quality... It is particularly amazing how many times the model hits the SLOPE right, even with delay... crazy right... Odds?

Or THIS ONE (with included timestamped BEFORE link/quote) that was epic...

Was talkinga bout this before, it is hard to "know" with close to very little doubt that something is appeared to be working... So I am on the careful side, even after 10+ years.. Because although the model have been working OMG at times, there were also "dark ages".. And I agree with HeyYou.. System works, untill it doesn't... So I am prepared it could fail in the next trade.... Or it could finally take off grandslam-homerun (again)

BTW for HeyYou and others... good quote... and movie..

7:00 Simon receives message

  1. SIMON: So what is it?
  2. VINCENT: It’s fractal theory. He is using it to try and predict the stock market correction.
  3. SIMON: And can he?
  4. Stipid: Not yet, but if these figures are accurate, he is getting very close.
  5. SIMON: I have seen this kind of thing before. A black box ???? 12 months before collapsing and taking a half a billion with it.
  6. VINCENT: This is much more advanced than that. He is smarter.
  7. SIMON: Yes, well they are all smarter, until they are not.

EPIC (much underrated movie) for anyone loving the math-stat and inspired by finding "THE FORMULA" for the market(s)
The Bank (2001)
https://www.imdb.com/title/tt0241223/

BTW.. I would still LOVE to find/extract LUCK vs JUICE in my or any others "model"... Help welcome BTW talked to many math/stat people... and traders.. but seems still not convinced because haven't found or teamed both so that I could be satisfied on both sides.. since many math/stat/sci people are "lost" in probabilities, do not see the bigger picture of trading for example... and something do appear to correlate.. for example stock markets, housing... STRONG historic FIT.. but could CORRECT nevertheless Also... many traders have no clue about math, stat... and they see "holy grail" in a fluke... Ok, anyway.. If anyone could derive luck vs juice out of the chart predictions that I posted, welcome...

Can you afford to take that chance?
 
 
  • Post #17
  • Quote
  • Dec 7, 2019 9:59am Dec 7, 2019 9:59am
  •  Tbtt
  • | Membership Revoked | Joined Dec 2019 | 83 Posts
You Can Test A Plan/An EA for past number of Years with a Same Setting One where Volatility was High One where Volatility was Low and if it passes both it will Pass most
 
1
  • Post #18
  • Quote
  • Dec 7, 2019 1:21pm Dec 7, 2019 1:21pm
  •  HeyYou
  • Joined Apr 2015 | Status: Member | 1,753 Posts
Quoting auricforecas
Disliked
{quote} You seems to have some background/idea about math-stat Here are my predictions... Do you think they were just luck/random? Many predictions vs actual... many timestamped in advance... Check here... This is the 5-month aftermath I was talking about.. (you can find more links in the quotes above, all chain of them from quote to quote) Full 5-month aftermath with all the links,...
Ignored


yes everybody acts as a succesful millionaire, they come here mocking backtesting...they call us "delusional" etc.

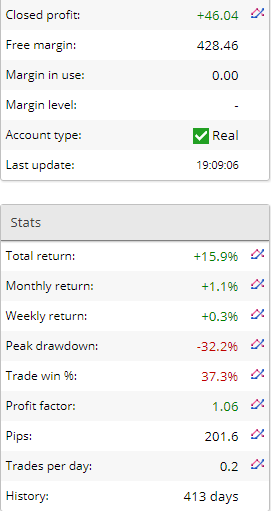
but in the end who is making money ?? ME

HERE... 45 bucks!


Attached Image


Just kidding guys, JK, JK... jeeesus, all this seriuosness was killing me.
 
 
  • Post #19
  • Quote
  • Dec 7, 2019 1:41pm Dec 7, 2019 1:41pm
  •  HeyYou
  • Joined Apr 2015 | Status: Member | 1,753 Posts
Quoting Tbtt
Disliked
You Can Test A Plan/An EA for past number of Years with a Same Setting One where Volatility was High One where Volatility was Low and if it passes both it will Pass most
Ignored
That sounds very interesting, thanks.
 
 
  • Post #20
  • Quote
  • Dec 7, 2019 3:51pm Dec 7, 2019 3:51pm
  •  hanover
  • Joined Sep 2006 | Status: ... | 8,092 Posts
Quoting HeyYou
Disliked
So guys, many people confuse curve fitting with optimization........
Ignored
My 2c fwiw:

Excellent posts by topherhk88 here and merlin here.

Bruce Babcock, a well known futures trader during the 1980s-90s, wrote a lot of good material about optimization. I found this as a starting point; you might be able to find more of his writing using Google.

Arguably even better, the quant systems developer and prolific writer Dr Daniel Fernandez shares much important info in his blog here. He deals with the pitfalls of curve fitting in many of his articles (perform a text search on the page for topics like "optimization" and "fitting").

Google is your best friend, it found these links (and many more) in just a few seconds: 1 2 3 4 5. [No offense to anybody, but I generally obtain higher quality info from internet searches (although it pays to do background checks on contributors, where possible) than ad hoc comments on trading forums. As always, don't take anything for granted and always experiment and prove ideas and assertions to your own satisfaction].
 
5
  • Trading Discussion
  • /
  • Curve fitting vs optimization
  • Reply to Thread
    • Page 1 2 3
    • Page 1 2 3
0 traders viewing now
  • More
Top of Page
  • Facebook
  • Twitter
About EE
  • Mission
  • Products
  • User Guide
  • Blog
  • Contact
EE Products
  • Forums
  • Calendar
  • News
  • Market
EE Website
  • Homepage
  • Search
  • Members
  • Report a Bug
Follow EE
  • Facebook
  • Twitter

EE Sister Sites:

  • Metals Mine
  • Crypto Craft
  • Forex Factory

Energy EXCH™ is a brand of Fair Economy, Inc.

Terms of Service / ©2023