Attached Image
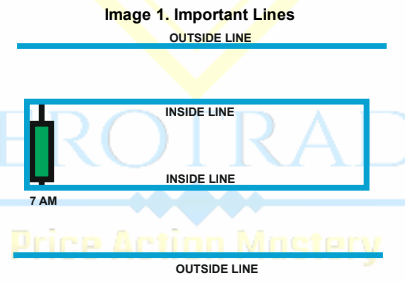
To understand the market behavior in Asian session i observed the movement by making some important lines like in Image 1. This observations are made in EUR/USD candlestick patterns in 24 hours from today Asian session opening hour until tommorow Asian session opening hour. In Image 1 we can see important lines i used to observe the behavior. The inside lines are the high and low levels of the 0.00 GMT (7.00 AM my time) candlestick and outside lines are 10 pips away from the inside lines.
Attached Image

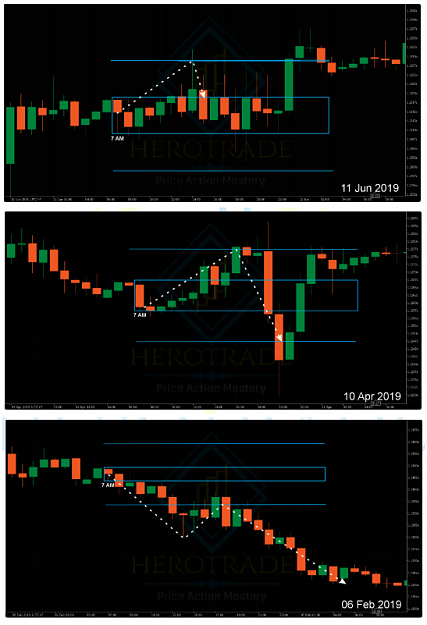
In Pattern A the price will move to touch an outside line and reverse to the closest inside line.
Attached Image

The Pattern B has movement like pattern A where the price will touch an outside line then reverse but to the other outside line.
Attached Image

Different from the patterns above, in pattern C after the price touch or cross an outside line, it will continue the trend until the end of the day or the average daily price movement range.
Attached Image
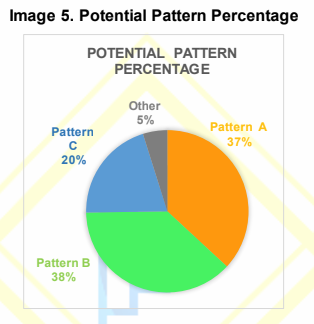
From these patterns we get potential pattern percentage chart in Image 5 based on the patterns formed in the last 6 months. The potential patterns that might be occured are about 95% where pattern B has the biggest potency up to 38%, pattern A up to 37%, and pattern C up to 20% while 5% could make other patterns. The real example of the patterns can be seen below.
Attached Image (click to enlarge)
This is just an idea from me, without any filters or entry points. Share your trading thought please...
(The pictures are from Herotrade Trading Group which i create myself, no need for copyright)