I'd like to restart a forum about my trend-following and right-side breakout intraday trading system, I failed to manage the old forum as it was hard to give live analysis here, so this time I will use another way - daily update. This will surely help me to maintain a trading journal and hopefully it could also help FF traders who are interested in this system.
Brief to the system
This system uses a trend-following and right-side breakout strategy; therefore, I only try to find entries on one direction based on my daily analysis. It could be working on any forex pairs, and I also use it on gold, silver and oil. Generally, at the beginning of each day, I search all pairs on high time-frame charts (Day, H4) and find several ones with clear direction bias during the day; then I wait for the entry signals on low time-frame (H1, M15, M5) to take entry. Some days there are several trading opportunities but some days there are none if no pairs have clear trend.
From my experience, if you only take the entry on very good patterns, you may reach 80% winning ratio. Though the number of trades falls, possibly 5-8 times a month, but with good risk reward ratio, you could still get fantastic result, maybe better.
About Risk Management
I don't want to talk much about risk management (money management). The rule is quite simple. Never risk more than 2% of the amount you wish to invest in forex market per trade. Example, if you wanna invest $10,000 in forex market, you can deposit all the money in your trading account, or half, or only $2000, but never lose $200 per trade. Use your balance and stop loss to calculate you lot size before take the entry. Don't dream of making your account double in few trades, if you risk 30% or 50% of your balance per trade, though you may have 80% winning ratio, you're still possible to lose everything.
Technical tools and indicators
No special indicators are used in this system, only basic tools and indicators are applied. From this aspect, I believe this system will keep being effective in a long run.
Candlesticks Patterns includes Marubozu, Hammer, Shooting Star, Engulfing, Morning & Evening Stars, etc. They are mainly used on higher time frame to determine the direction. Chart Patterns includes Double Tops/Bottoms, Head and Shoulders, Rectangle Patters, Wedge Patterns, etc. They are used on higher time frame to determine the direction and trading room.
Support & Resistance Levels includes Horizontal S&R levels, Trendline, Fibonacci level. They are used to determine if there are enough room for trading.
Moving Average includes 15EMA used as S&R levels and 50SMA used as an reference for direction.
Multiple Time Frame Analysis. With other tools/indicators, we find the trading direction on higher (H4, Day) time frame and entry opportunities on lower (H1, M15, M5) time frame.
Stochastic Oscillator (5,3,3) is only used on H4 chart to support our decision, it confirms long when it goes up or above 80, or confirms short when it goes down or below 20. It is only a supportive indicator and sometimes it could be ignored.
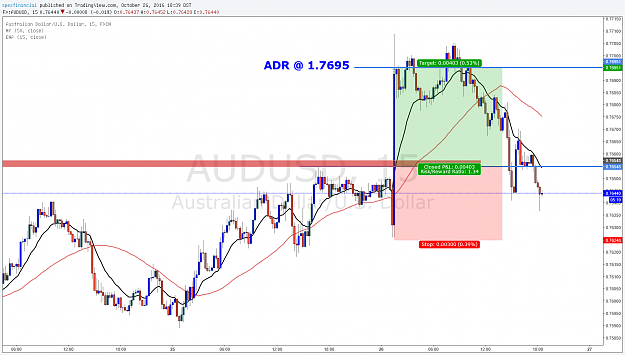
ADR (20) is used to confirm if there is enough room for intraday trading. If the range between current price and ADR line is smaller than stop loss, give up this entry. There is no ADR indicator on MT4 and for copyright reason I cannot share it here. You can use ATR (20) on daily chart, and it has the same value as ADR. Otherwise you can PM me and I can send it to you via email.
Checklists before taking the entry
1. Always follow the intraday trend on high time frame (day chart, H4 chart)
2. Have enough trading range between entry price and key S&R level (also ADR)
3. Reasonable risk - risk reward ratio must bigger than 1 (actually only 1.5 or more potential risk reward ratio is attractive to me)
4. Right-side trading - don't trade at important S&R levels, trade after they are broken
5. Price has tested or broken key level before breakout
6. Candlesticks pattern supports trading direction
7. Indicators support trading direction (H4 Stoch, MAs on M15 chart)
8. Price has a fake/cheat movement before breakout
1-4 are essential and more rules from 5-8 you follow more chance you could win.
Brief to the system
This system uses a trend-following and right-side breakout strategy; therefore, I only try to find entries on one direction based on my daily analysis. It could be working on any forex pairs, and I also use it on gold, silver and oil. Generally, at the beginning of each day, I search all pairs on high time-frame charts (Day, H4) and find several ones with clear direction bias during the day; then I wait for the entry signals on low time-frame (H1, M15, M5) to take entry. Some days there are several trading opportunities but some days there are none if no pairs have clear trend.
From my experience, if you only take the entry on very good patterns, you may reach 80% winning ratio. Though the number of trades falls, possibly 5-8 times a month, but with good risk reward ratio, you could still get fantastic result, maybe better.
About Risk Management
I don't want to talk much about risk management (money management). The rule is quite simple. Never risk more than 2% of the amount you wish to invest in forex market per trade. Example, if you wanna invest $10,000 in forex market, you can deposit all the money in your trading account, or half, or only $2000, but never lose $200 per trade. Use your balance and stop loss to calculate you lot size before take the entry. Don't dream of making your account double in few trades, if you risk 30% or 50% of your balance per trade, though you may have 80% winning ratio, you're still possible to lose everything.
Technical tools and indicators
No special indicators are used in this system, only basic tools and indicators are applied. From this aspect, I believe this system will keep being effective in a long run.
Candlesticks Patterns includes Marubozu, Hammer, Shooting Star, Engulfing, Morning & Evening Stars, etc. They are mainly used on higher time frame to determine the direction. Chart Patterns includes Double Tops/Bottoms, Head and Shoulders, Rectangle Patters, Wedge Patterns, etc. They are used on higher time frame to determine the direction and trading room.
Support & Resistance Levels includes Horizontal S&R levels, Trendline, Fibonacci level. They are used to determine if there are enough room for trading.
Moving Average includes 15EMA used as S&R levels and 50SMA used as an reference for direction.
Multiple Time Frame Analysis. With other tools/indicators, we find the trading direction on higher (H4, Day) time frame and entry opportunities on lower (H1, M15, M5) time frame.
Stochastic Oscillator (5,3,3) is only used on H4 chart to support our decision, it confirms long when it goes up or above 80, or confirms short when it goes down or below 20. It is only a supportive indicator and sometimes it could be ignored.
ADR (20) is used to confirm if there is enough room for intraday trading. If the range between current price and ADR line is smaller than stop loss, give up this entry. There is no ADR indicator on MT4 and for copyright reason I cannot share it here. You can use ATR (20) on daily chart, and it has the same value as ADR. Otherwise you can PM me and I can send it to you via email.
Checklists before taking the entry
1. Always follow the intraday trend on high time frame (day chart, H4 chart)
2. Have enough trading range between entry price and key S&R level (also ADR)
3. Reasonable risk - risk reward ratio must bigger than 1 (actually only 1.5 or more potential risk reward ratio is attractive to me)
4. Right-side trading - don't trade at important S&R levels, trade after they are broken
5. Price has tested or broken key level before breakout
6. Candlesticks pattern supports trading direction
7. Indicators support trading direction (H4 Stoch, MAs on M15 chart)
8. Price has a fake/cheat movement before breakout
1-4 are essential and more rules from 5-8 you follow more chance you could win.