I'm currently struggling to understand the logic behind the concept that 'a broken trendline may indicate the end of a trend'.
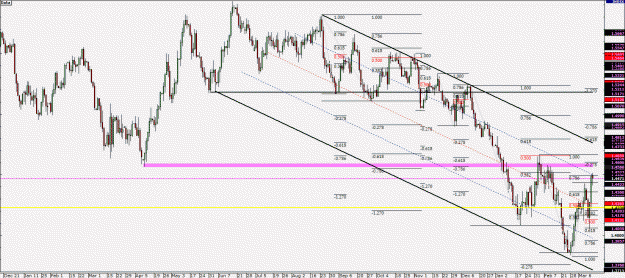
The way I see it, price movement is not linear, and there's no economic reason why the break of some linear line may suggest that the associated trend is more likely to end (unless it's just a self fulfilling prophesy?). In addition to this, it's possible to redraw trendlines (which are just as valid) so that price has or hasn't crossed it.
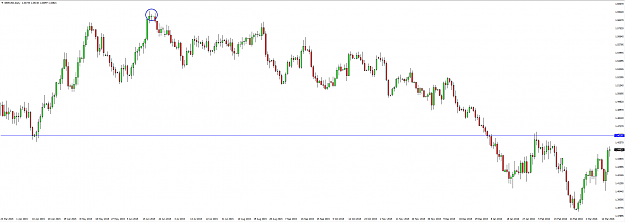
I agree with the logic behind drawing horizontal lines on a chart to represent potential levels of supply and demand, but the logic behind trendlines seems redundant. Can anyone supply an argument to prove me wrong?
The way I see it, price movement is not linear, and there's no economic reason why the break of some linear line may suggest that the associated trend is more likely to end (unless it's just a self fulfilling prophesy?). In addition to this, it's possible to redraw trendlines (which are just as valid) so that price has or hasn't crossed it.
I agree with the logic behind drawing horizontal lines on a chart to represent potential levels of supply and demand, but the logic behind trendlines seems redundant. Can anyone supply an argument to prove me wrong?