I'm finally making a pause after a long EA development and while I was going back cleaning and reading some notes on my paper journal I was intrigued by a note saying The Free Trade in which I explain a kind of pyramiding which if executed properly could provide such a thing but I just wasn't capable in remembering how and my notes were awful.
I remember that I got that technique from some trading system, course or article on the internet so no credit is due to me here, but It was impossible to find the original paper containing all the explanations so if you find the original source or some article explaining it better than me, don't hesitate to share it here. Personally, with what I had on hand, I went on an Excel sheet and reconstructed it step by step.
I also think that this kind of trading technique must be well known among a majority of traders, if this is your case, sorry for repeating it here but I think that this can still be useful for people not knowing it yet. If that is the case, don't expect neither something spectacular nor new here but instead something interesting to know and to add to your trading toolbox.
I added Chart Patterns to the Free Trade title with the aim of improving their recognition and trading. This means that I will periodically post current chart patterns on which I will try to deploy the Free Trade technique described here.
This is a journal
I consider myself not a good trader, meaning that I could say that through my glasses I see a graceful giraffe coming to me when instead its an awful elephant. So don't trust what I say and don't hesitate to discuss the charts and the technique itself, the only thing I ask you is to be courteous and respectful.
A trade explorer will be attached to backup the charts.
What is described here is a technique, not a system
Unlike a proper system which provides clear rules for entering the market, there is no such a thing here and I will rely only on chart patterns for that. On the contrary, once that I have the entry and target, all other trade levels are mathematical.
Altogether, when executed properly the technique provides a trade setup with a risk reward ratio of 1 to 6, meaning that 1 setup executed properly out of 6 will compensate the 5 losing and add profits to the account.
Usage Considerations
Instruments (pairs) to trade:
Any.
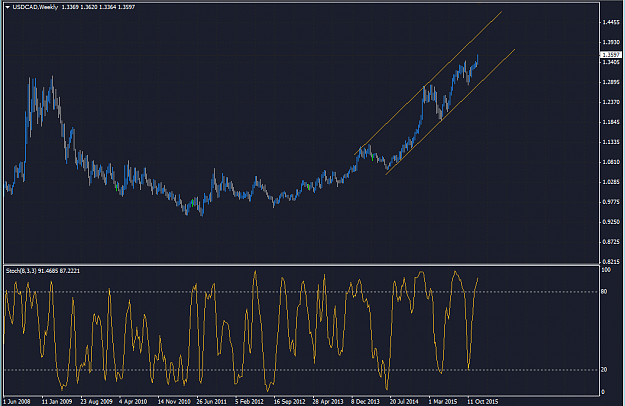
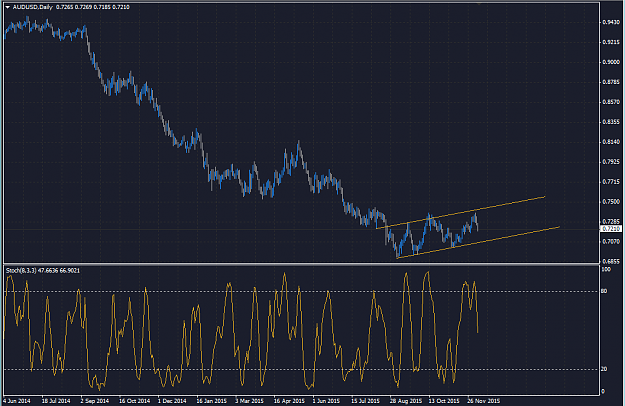
Time frames to trade:
The trade requires a target which must be, if possible, several hundreds of pips away, so large time frames will be needed for that. I'm talking about the daily and weekly time-frames. I will concentrate on daily and weekly time-frames only.
Swap:
Swap must be considered on high swap cost currencies.
Risk to take on each setup:
1/6 of account will be used for each position.
This means that each lost trade will wipe out 17% of account while each winning one will earn 100%.
Usage of indicators:
Pattern trading is almost price action trading and given the large time-frames traded, there is no need for surgical entries, so no indicator will be used.
Special Trader Abilities:
Mainly Patience as large time frames are traded.
Building the Free Trade
Here we are...
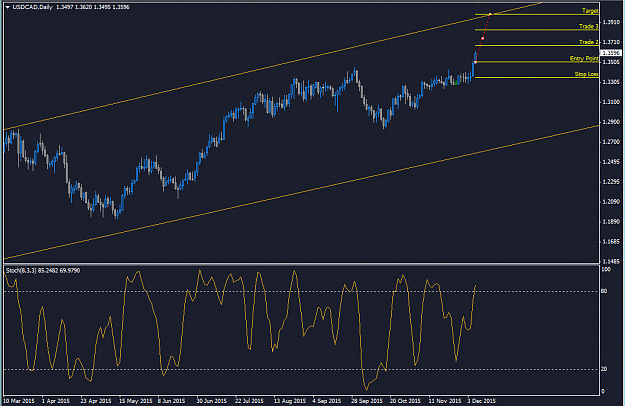
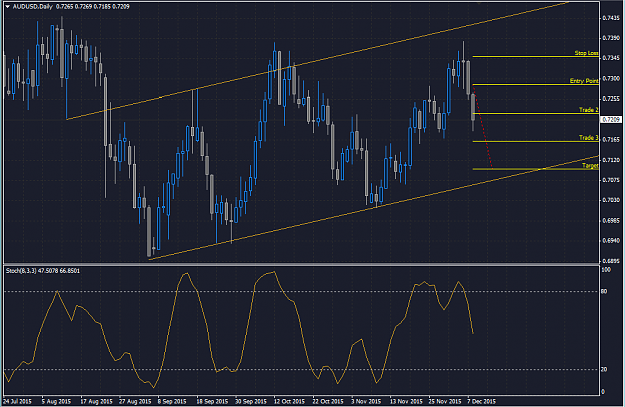
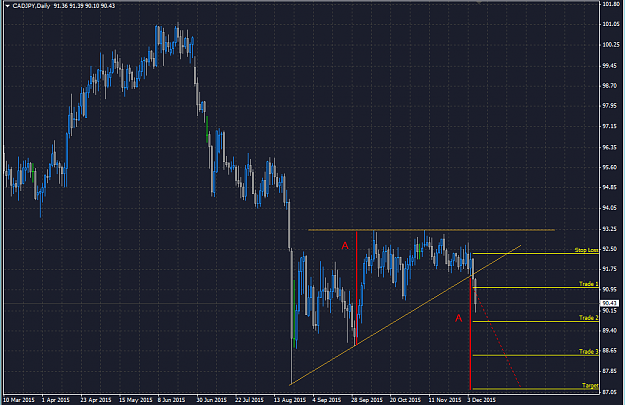
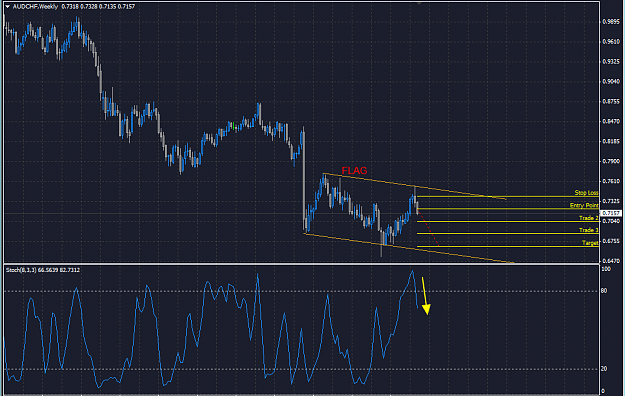
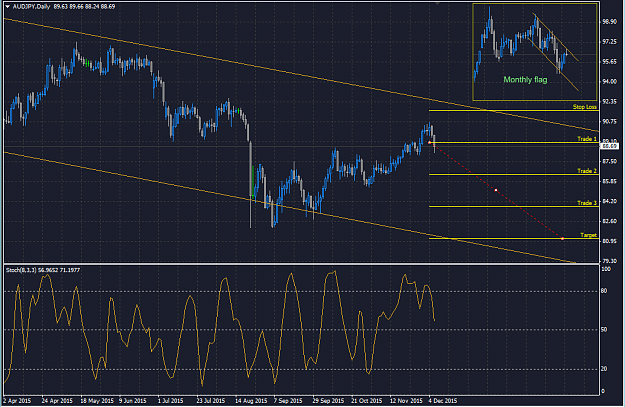
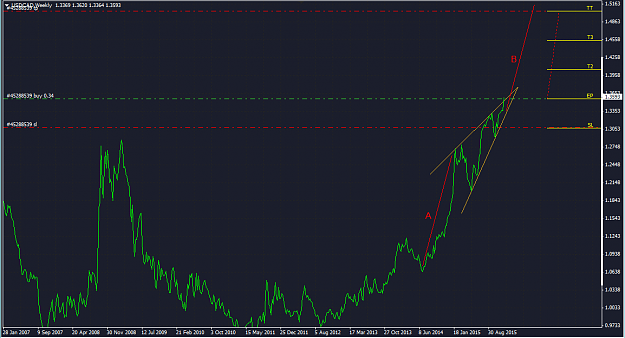
The Free Trade is a composite of 3 trades of equal size that are situated at equidistant intervals almost like in a rigid grid. Each trade is entered in the direction of the price, so we add positions on winning trades only. The initial Stop Loss of the first trade is entered at the same interval distance from the entry point. When a new level is reached in our direction we move the stop loss of precedent trades to the previous level and we enter the following trade. When the last (4th) level is reached, we take our profits and go for some beers. If you prefer wine, it's also OK.
Lets illustrate this with an example. Lets say that we have identified a trade which has a potential target, or potential move of 330 pips on the long side.
To calculate the distance between each level which is also the Stop Loss distance from the Entry Point, we simply divide the target distance from the entry point, in our case 330 pips by 3, so 330 / 3 = 110. I will call this variable DX, which is the distance between price levels. So in total, we have 5 important price levels at 110 pips interval:
<SL> DX <EP> DX <T2> DX <T3> DX <TT>
where: SL=Stop Loss, EP=Entry Point, T2=Trade 2, T3=Trade 3, TT=Target, DX=110 pips.
For our example, lets put the entry point at 1.2000 and calculate the different price levels, remember that this is a long trade :
Stop Loss = 1.1890 (1.2000-110 pips)
Entry Point = 1.2000
Sencond Entry = 1.2110 (1.2000+110 pips)
Third Entry = 1.2220 (1.2000+220 pips)
Target = 1.2330 (1.2000+330 pips)
With our price levels in place, lets write down all the possible scenarios:
First scenario, we loss right from start:
- We enter long at 1.2000, SL at 1.1890
- Stop Loss reached => We lose 110 pips.
- P/L = -110 pips.
Second Scenario, we reach 2nd level and then, price retracts to first level:
- We enter long at 1.2000, SL at 1.1890
- Price moves to 1.2110.
- We move SL of Trade 1 at BE.
- We enter long at 1.2110, SL at 1.2000
- Price retracts to 1.2000
- Trade 1 is closed at BE, Trade 2 is closed at -110 pips
- P/L = -110 pips.
Third scenario. we reach 3rd level and price retracts to 2nd level:
- We enter long at 1.2000, SL at 1.1890
- Price moves to 1.2110.
- We move SL of Trade 1 at BE.
- We enter long at 1.2110, SL at 1.2000
- Price moves to 1.2220
- We move SL of Trade 1 at +110
- We move SL of Trade 2 at BE
- We enter 3rd trade at 1.2220 SL at 1.2110
- Price retracts to previous level at 1.2110
- Trade 1 is stopped out at +110, Trade 2 stopped out at BE, Trade 3 stopped out at -110
- P/L = 0, THIS IS THE FREE TRADE !
Fourth Scenario, we reach our target:
- We enter long at 1.2000, SL at 1.1890
- Price moves to 1.2110.
- We move SL of Trade 1 at BE.
- We enter long at 1.2110, SL at 1.2000
- Price moves to 1.2220
- We move SL of Trade 1 at +110
- We move SL of Trade 2 at BE
- We enter 3rd trade at 1.2220 SL at 1.2110
- Price moves to our target which is 1.2330
- We close Trade 1 at +330, Trade 2 at +220 and Trade 3 at +110
- TOTAL GAIN = 330+220+110 = 660 pips
You can see that at any time between Entry Point and Level 2 the maximum risk is -110.
If Level 3 is reached,the maximum risk becomes zero, the setup is now a free or riskless trade !
And finally, if target is reached, we collect all the gains which are 6 times what we risk during the whole process.
What's next ?
Live Entries and targets on chart patterns, Let's see how far I can go on this...
Update 1.
Please disregard charts from post 2 to 13 included.
Update 2. Recycling a Trade.
As a general rule, when a pattern clearly fails, there is no need to continue the trade if we still have several tens or hundreds pips to go before reaching the SL. This allows to "recycle" the trade and eventually change direction on the same instrument or just save the pips for another trade.