- Psychology and trading mindset. If we dont understand ourselves how can we understand the market? If we cannot control our own emotions, no trading system will work for us because we will never be able to follow it precisely. "Trading in the Zone" by Mark Douglas is a must read book in this section.
- Price Action. Instead of using a lot of fancy indicators without clear understanding what they mean, I prefer to analyze the source of all the calculations in these indicators the price itself. Bob Volman provides very good overview in his book "Understanding Price Action".
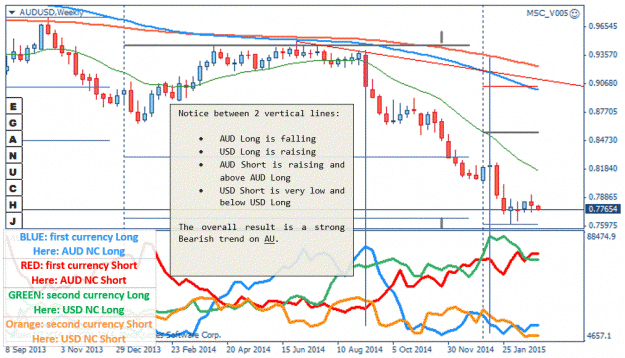
- Currency Correlation. Because on Forex we are trading pairs consisting of 2 currencies, they both influence the performance of the trading pair in question. Accordingly there will be correlation between 2 trading pairs if they share the same currency.
- Commitment of Traders (COT). For long term analysis we have an indicator that adds some new to our trading system, instead of recalculating the price. COT data allows us to watch the change in positions of large speculators and analyze the price action with that in mind. "Trade Stocks and Commodities with the Insiders" by Larry Williams and "The Commitment of Traders Bible" by Stephen Briese are two books I recommend.
From these four topics, Psychology is by far the most important one. To me, the other three are useless without understanding of human psyche. When we analyze the Price Action, I am not looking for some candle patterns. Instead, I am trying to think about the traders who stand behind the price movement in each candle, their reasons to be bullish or bearish, where they are likely to take profit or loss and their emotions.
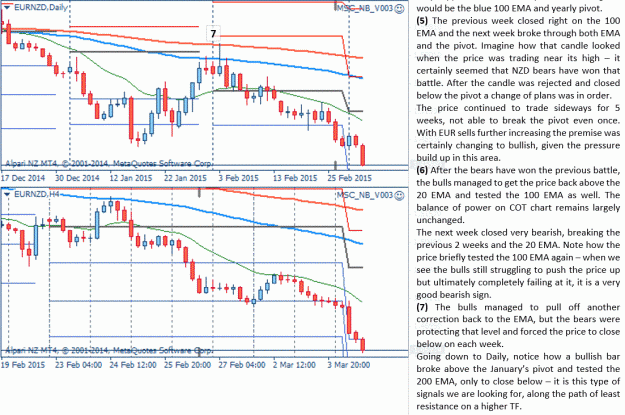
COT data helps us to see the actual change in positions of really large traders, who influence the price greatly. Once again, I do not believe there is some unique trading pattern in this data that will help making money all the time. Instead, I am trying to understand their psychology as well.
A couple notes about the general direction of this thread.
- I am not planning to provide any trading signals here whatsoever. Instead, I am planning to review the markets together and gain increasing understanding of the whole picture. The individual trade entries are up to you. In that sense, I am not really trying to show my trading system per se. I am simply trying to show an alternative view at the markets, a framework that we can operate from.
- The discussion I would like to have here is aimed for mid to long term trading. The main analysis timeframe is weekly, with Daily being used for entries and H4 for further price action clarification (sometimes entries are taken on H4 as well). The analysis takes considerable amount of time but there should be no need to watch the live market non-stop, looking for entries.
- I will discuss Money and Risk management as well, explaining my point of view on profit expectation and emphasizing that your goal #1 should be survival on the market. Play good defense before you play offense. I am also hoping to show that it is possibly and feasible to trade weekly trends even with a very small account, starting as low as $5000 (0.01 lots will be necessary though, but even 1:50 leverage is plenty).
Basically, the thread will consist of articles on psychology, trading business, money/risk management and regular market analysis (if all goes well, that is). We will use all major trading pairs (all EUR, GBP, AUD, NZD, USD, CAD, CHF and JPY pairs). I hope to update the first post later on with relevant information as the thread will start taking shape.t
Getting Started
To get started all you need to do is understand what COT is about. On my charts I use freely available indicators from Meta COT project: https://www.mql5.com/en/articles/1573
This is a big article and took me about 2 weeks to completely absorb when I started. It is essential to read it all, because the instructions on how to get started with COT indicators are there as well. My suggestion is to do it gradually, 30-60 minutes a day. The updated source code for the indicators is here, if you want to explore all Meta COT project: https://www.mql5.com/ru/articles/dow...14_03_2011.zip
Simple installation
After going through all the available indicators many times in addition to writing a couple of my own I decided to go back to the basics and simply try to do a psychological analysis of market Price Action in combination with Absolute positions of Large Speculators (Non-Commercial, NC for short). Therefore you do not need to install the whole Meta COT project if you simply want to follow this thread.
This archive includes only the necessary indicators used on all my pictures together with a template.
The contents:
- COT Absolute positions indicator and all COT files necessary for its work.
- Auto pivot indicator that I wrote for higher charts. It will show Yearly pivots on Weekly chart, Montly pivots on Daily charts and Weekly pivots on H4 charts. This indicator is used in all pictures for Sup/Res reference.
- Template with COT indicator set up for EURUSD as an example. See below how to set it up for other pairs. The template is setup with Pivot indicator and 3 EMAs as well.
Installation instructions:
- Open your MT4 data folder (in MT4 press File -> Open Data Folder);
- Extract the archive right in that folder. It will automatically put one template into /templates, indicators into /MQL/indicators, scripts into /MQL/scripts/ and files into /MQL/files.
Now you have the tools setup, but in order to use COT you need the data. I downloaded and compiled all the COT data starting at 2004. I will be updating the current data file in this thread as it is being released by the commission. When unpacked, data files should amount to ~82mb. This archive does not include data for 2015, since we will need to update it weekly (see below).
Because the data archive is too big, here is an alternative download location:
COT data 2004-2014
I was not able to upload it as attachment.
Data installation:
- Open your MT4 data folder (in MT4 press File -> Open Data Folder);
- Navigate to /MQL/Files/
- Extract data archive there. It should create 12 data files.
These steps must be done any time you update the data (first installation and later each week when you load new data file):
- In /MQL/Files/ folder run erase_cot.bat file - it will delete any data that was created before.
- Open your terminal and run "Meta COT Script Build" script on any chart
- Run "Meta COT Script Concatenate" script on any chart
- Restart terminal
2015 Data file updates
Each week we need to load a new data file to update the indicators. Here I will be updating this data file, already formatted and renamed. All you need to do is to extract it into /MQL/Files folder and update the data, following the same instructions above. Because there is one data file for 2015, it will ask you if you want to rewrite the old file when you do the updating - answer 'yes'.
Working with the indicator
Open any chart and load "COT_abs_position" template. By default it will load the indicators for EUR and USD futures. When you switch the trading pair, the COT indicator will stay the same, as you need to tell it to load the right data file. In the settings of the indicator there is a "file_name" parameter. Here is the list of file names for all 8 major currencies that you need to use:
- EUR - "COT - EURO FX CONCATENATE.csv"
- GBP - "COT - BRITISH POUND STERLING CONCATENATE.csv"
- AUD - "COT - AUSTRALIAN DOLLAR CONCATENATE.csv"
- NZD - "COT - NEW ZEALAND DOLLAR - CHICAGO MERCANTILE EXCHANGE .csv"
- USD - "COT - U.S. DOLLAR CONCATENATE.csv"
- CAD - "COT - CANADIAN DOLLAR CONCATENATE.csv"
- CHF - "COT - SWISS FRANC CONCATENATE.csv"
- JPY - "COT - JAPANESE YEN CONCATENETE.csv"
Let's say you want to switch to AUDNZD, therefore you want Blue and Red lines to show Long and Short positions for AUD and Green and Orange to show Long and Short positions for NZD. Follow these steps:
- Double click Blue or Red line on the indicator to open its settings
- In file_name parameter enter "COT - AUSTRALIAN DOLLAR CONCATENATE.csv"; press OK
- Double click Orange or Green line to open the second indicator
- In file_name parameter enter "COT - NEW ZEALAND DOLLAR - CHICAGO MERCANTILE EXCHANGE .csv"; press OK
Ideally though, just create a profile for all the charts you want to watch, set the indicators one time and never worry about it again. I personally use Currency profiles: one for all EUR charts, one for all GBP charts, USD charts, etc.
Additional information
Why Speculators and not Commercials? I am interested in understanding of the psychology behind the positions and when I see the NC being heavily on the long side while the market is going down I know they are losing money and not liking it. Together with price action analysis this can be invaluable information. Commercials, as you know, may seem to lose all the time but they are on the market for different reasons - they hedge their risks. Therefore it is more difficult to predict their actions and more importantly their reasons.
Why not Net positions? Simply because I would like to see when one side starts moving, it gives me a little bit more to think about.
One unorthodox element in my analysis is that for each pair I analyze COT data for both currencies. I realize that COT data is published for currency futures and EUR COT data corresponds to EURUSD pair. However, I found that knowing the COT data for USD is just as important. On Forex we don't trade the currencies - we trade the difference between 2 currencies and so analyzing them both seems logical. This also allows me to speculate about the influence of COT on cross pairs, such as EURGBP or GBPNZD, etc.
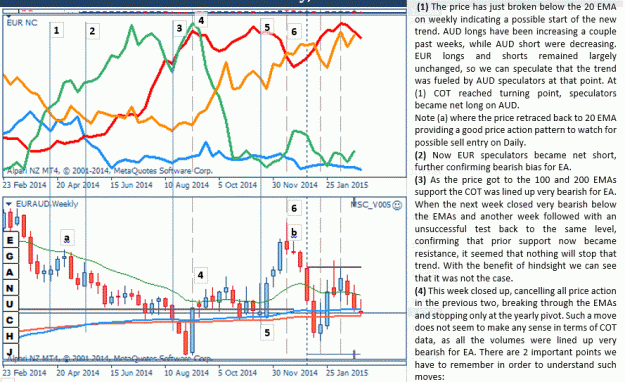
The legend explains the COT indicator, which shows Long and Short positions for AUD and USD currencies separately. On the chart I use 3 EMAs (20, 100 and 200) and Pivot points - only to watch the price action around these potential levels of Sup/Res.
List of abbreviations
Any currency can be abbreviated with its first letter:
- U – USD, US Dollar
- E – EUR, Euro
- G – GBP, British Pound
- C – CAD, Canadian Dollar
- H – CHF, Swiss Franc, (because C is already used for Canadian Dollar)
- A – AUD, Australian Dollar
- N – NZD, New Zealand Dollar
- J – JPY, Japanese Yen
- M – MXN, Mexican Peso
Similarly any trading pair can be shortened to 2 letters. Examples:
- EURUSD – EU
- USDMXN – UM
- CHFJPY – HJ
Support and Resistance levels:
- S – Support
- R – Resistance
- SR – Support and Resistance (when referred to in general)
- TL – Trend Line
- Ch – Channel
- PP – Pivot Point
Time frames
- TF – Time Frame of the chart
- MN – Monthly
- W1 – Weekly
- D1 – Daily
- H4 – 4 hours
- H1 – 1 hour
Commitment of Traders
- COT – Commitment of Traders
- NC – Non-Commercial
Phases
I see this thread going through a couple phases in course of its development
- First of all we need to build a framework to see the market in a certain way. During this phase I am going to analyze all 28 major trading pairs on history and try to find explanation why certain moves started and ended the way they did. Here I am using the benefit of hindsight, purposely finding the ideal point of reversal first and then thinking how it was possible to anticipate it or when was the new trend confirmed inside of our analysis framework after the reversal.
I expect this phase to continue for at least a month and there will be a lot of charts to analyze in detail. - Second phase is to identify certain rules of analysis that we found during the first phase and then start applying them to the current markets, by following all 28 trading pairs bar by bar on Weekly and Daily as they unfold.
- The last phase is to identify entry points in the direction of the prevailing bias that we find while doing market analysis.
With all this in mind I want the reader to understand the purpose of the current analysis that will be posted during phase 1. There will be no trading signals to follow and any speculation about further price movement is irrelevant at this stage, as we are trying to polish the analysis framework by learning from history.
When we get to the second phase, the most important step of higher timeframe analysis is to filter out one side of the market. At any given point the trader can only do
3 things on the market: buy, sell or do nothing. The purpose of the first stage in my analysis is to filter out one of these possibilities, therefore simplifying the decision making process when a trade opportunity presents itself. Because you should always give yourself the freedom to do nothing on the market, we are looking for trading pairs where it is possible to filter out either buying or selling. That's it, as simple as that - the analysis is finished when we identified that the chances of the price going in one direction are higher than in the other.
Certainly, there are situations when buying or selling opportunities are present with similar chances of success (which is to say, 50/50) but I naturally prefer to avoid such markets and look for potential trades elsewhere.