Hello, i have a pretty interesting idea i have not seen before (if someone spotted this one before please post it in here).
I also think the code should not be complex. It pretty much includes what is shown in below image.
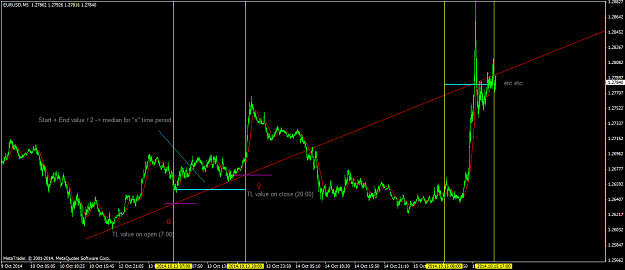
1.It should have an option to set a start and end time.
2.Then it should select all trendlines currently shown on screen.
3.Take the start value at start time period input + end value at end time period input and divide it by two (per trendline).
4.Plot a median of the trendline as a projection in the future from and till the previously selected start and end time periods.
The above would help a trader that works specifically of limit orders and such, with the use of multiple trendlines.
Thank you for your time.
Regards
I also think the code should not be complex. It pretty much includes what is shown in below image.
1.It should have an option to set a start and end time.
2.Then it should select all trendlines currently shown on screen.
3.Take the start value at start time period input + end value at end time period input and divide it by two (per trendline).
4.Plot a median of the trendline as a projection in the future from and till the previously selected start and end time periods.
The above would help a trader that works specifically of limit orders and such, with the use of multiple trendlines.
Thank you for your time.
Regards
Attached Image (click to enlarge)