Hi guys,
I'm developing a touch trading method based on the confluence of two or more of these levels:
- round numbers (every 100 pips)
- supports or resistances on daily
- supports or resistances on H4
I have attached two indicator which plot support and resistance levels for any timeframe (indicator: Support-Resistance) and plot horizontal lines on big round number (Indicator: Grid_v1_0)
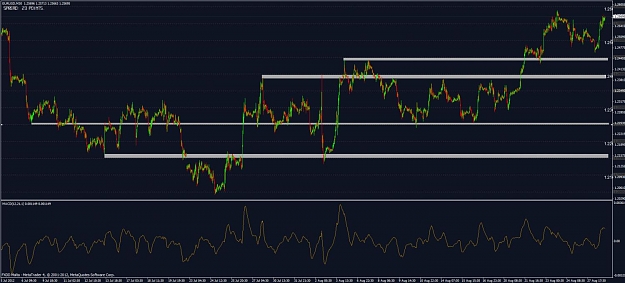
Now download the indicators, open a H4 chart and attach the indicators in order to spot:
- daily resistances or supports in the last 100 bars
- H4 resistances or supports in the last 600 bars
- round numbers every 100 pips.
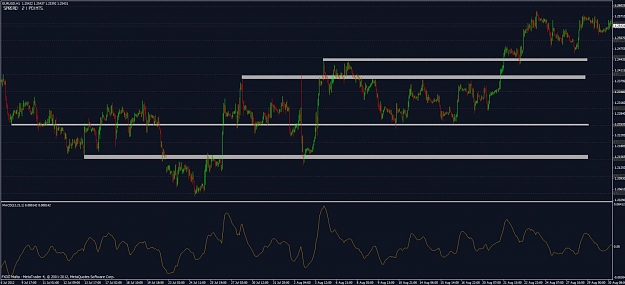
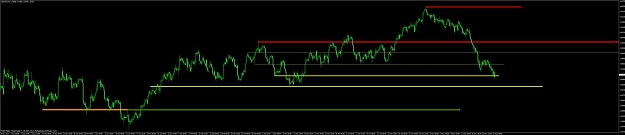
You can clearly see that there's usually a high probability for price to choppy or bounce where there's a confluence of a round number level and one or more support or resistance level of daily/H4 timeframe within a small range of maximum 10 pips.
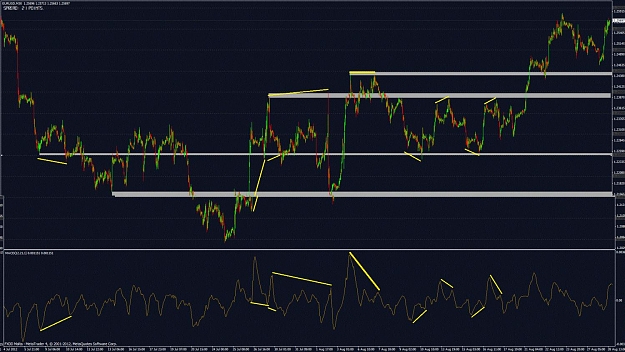
Usually the more confluence of those levels we have, the strongest the signal. I attached a chart below where I marked with yellow/orange/red zones the levels where confluence levels lies.
I found very interesting to analyze the behaviour of price when it reaches those zones, and so I decided to post there to request a quick coding to develop a simple indicator which combine all these levels to show only the one where there's a huge confluence.
In particular, the indicator should idenfity all the zones of maximum 10 pips where one round number and a S/R level of daily or H4 lies and then draw a little box (like the one I've drawn by myself), making it start from the point where the R/S was formed.
In addiction, to distinguish the best zones, the EA should:
- Draw a yellow zone where a round number lies near one or more H4 support or resistance level within 10 pips.
- Draw an orange zone where a round number lies near one or more DAILY support or resistance level within 10 pips.
- Draw a red zone where a round number lies near one or more H4 support or resistance level AND one or more DAILY R/S within 10 pips.
You can change the colours to light blue/blue/dark blue but the concept remain the same: the difference in colours is a method to identify levels of price with major confluence.
The interaction of price with those levels (note that I call it "levels" but since we are trying to find confluence within a 10 pips range we might also call them "zones") is quite interesting and it would not be so hard to code an EA to take an advantage from such confluence. Anyway, I believe that an indicator that show those confluence levels would be very useful to any style of trading.
Additional considerations:
- Note how the presence of a notable MACD or RSI divergence while price is touching those levels skyrocket the chance of seeing the price bounce for a nice move (divergence add some more strenght to the confluence)
- It would be nice to additionally include S/R from H1 timeframe AND/OR 50 pips round numbers for trading on lower timeframes
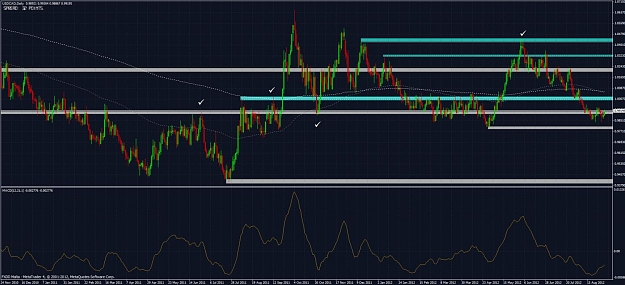
- Note how price tend to touch and reject from those levels. It is very rare for price to break those levels without rejecting for at least 25-30 pips
- Note how when a confluence level is broken by a notable amount of pips as support or resistance, every time price approach again to it price almost never reject (in other words, once a level is broken, it usually lose relevance and it seems to have no more impact on price).
- Some more confluence factor might be found in fibonacci retracements or pivot levels, but i'm not so sure these extra levels would make the confluence levels more reliable.
- It might be useful to display levels where multiple R/S coincide.
- Very useful levels to confirm candle pattern signals.
Behind the simply method I'm showing here, I want to point out that confluence of more than two of these strong levels (which can be a S/R or a pivot or a round number, etc...) I believe is a very interesting concept to work on.
It would be nice to code an indicator to spot those confluence levels, however... let me know you opinions about it. Comments are welcome.
I'm developing a touch trading method based on the confluence of two or more of these levels:
- round numbers (every 100 pips)
- supports or resistances on daily
- supports or resistances on H4
I have attached two indicator which plot support and resistance levels for any timeframe (indicator: Support-Resistance) and plot horizontal lines on big round number (Indicator: Grid_v1_0)
Now download the indicators, open a H4 chart and attach the indicators in order to spot:
- daily resistances or supports in the last 100 bars
- H4 resistances or supports in the last 600 bars
- round numbers every 100 pips.
You can clearly see that there's usually a high probability for price to choppy or bounce where there's a confluence of a round number level and one or more support or resistance level of daily/H4 timeframe within a small range of maximum 10 pips.
Usually the more confluence of those levels we have, the strongest the signal. I attached a chart below where I marked with yellow/orange/red zones the levels where confluence levels lies.
I found very interesting to analyze the behaviour of price when it reaches those zones, and so I decided to post there to request a quick coding to develop a simple indicator which combine all these levels to show only the one where there's a huge confluence.
In particular, the indicator should idenfity all the zones of maximum 10 pips where one round number and a S/R level of daily or H4 lies and then draw a little box (like the one I've drawn by myself), making it start from the point where the R/S was formed.
In addiction, to distinguish the best zones, the EA should:
- Draw a yellow zone where a round number lies near one or more H4 support or resistance level within 10 pips.
- Draw an orange zone where a round number lies near one or more DAILY support or resistance level within 10 pips.
- Draw a red zone where a round number lies near one or more H4 support or resistance level AND one or more DAILY R/S within 10 pips.
You can change the colours to light blue/blue/dark blue but the concept remain the same: the difference in colours is a method to identify levels of price with major confluence.
The interaction of price with those levels (note that I call it "levels" but since we are trying to find confluence within a 10 pips range we might also call them "zones") is quite interesting and it would not be so hard to code an EA to take an advantage from such confluence. Anyway, I believe that an indicator that show those confluence levels would be very useful to any style of trading.
Additional considerations:
- Note how the presence of a notable MACD or RSI divergence while price is touching those levels skyrocket the chance of seeing the price bounce for a nice move (divergence add some more strenght to the confluence)
- It would be nice to additionally include S/R from H1 timeframe AND/OR 50 pips round numbers for trading on lower timeframes
- Note how price tend to touch and reject from those levels. It is very rare for price to break those levels without rejecting for at least 25-30 pips
- Note how when a confluence level is broken by a notable amount of pips as support or resistance, every time price approach again to it price almost never reject (in other words, once a level is broken, it usually lose relevance and it seems to have no more impact on price).
- Some more confluence factor might be found in fibonacci retracements or pivot levels, but i'm not so sure these extra levels would make the confluence levels more reliable.
- It might be useful to display levels where multiple R/S coincide.
- Very useful levels to confirm candle pattern signals.
Behind the simply method I'm showing here, I want to point out that confluence of more than two of these strong levels (which can be a S/R or a pivot or a round number, etc...) I believe is a very interesting concept to work on.
It would be nice to code an indicator to spot those confluence levels, however... let me know you opinions about it. Comments are welcome.
Attached Image (click to enlarge)
Attached File(s)