Dear All,
Recently I have started a blog where I’m using rather unconventional way to analyze and forecast future S/R of EUR/USD with Fibonacci retracement tool. Although in the blog I mainly concentrate on a daily chart I also use this method on 4h and 1h chart to forecast my targets.
I have attached my last post together with screenshot, hopefully that will make it slightly clearer what I’m up too. Please also look up the blog for more screenshots. I will do my best to keep this thread up to date.
I would appreciate any comments and constructive criticism.
Tom
http://4.bp.blogspot.com/-yFKX5L9faA...NU/s1600/4.gif
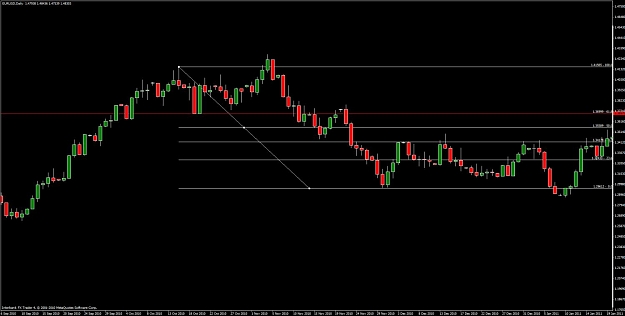
In the last few days our forecasted levels provided good support and resistance. Currently after a break out, 1.4797 level provided a good support and as long as this level holds we got a good potential for further rise. The next key resistance level is 1.4981, if the price will manage to break this level the next resistance is 1.5278. If the price will reach this level we will be expecting to see a pull back all the way back to the 1.4981. It is important to note that the stochastic has been overbought for an extended period of time on a daily and weekly time frame.
Knowing these we can play this setup in two ways. We can go long on the sustained break of 1.4981 targeting 1.5278. If the price will move too far on the breakout I would not advise to chase the trade and instead go long on a pull back. The second option is to go short from 1.5728 targeting 1.4981 level.
If you have any comments please do not hesitate to contact me. I will be more than happy to discuss any issues with you.
S/R Levels:
1.4649
1.4797
1.4981
1.5278
Tomasz Gdynia
[email protected]
____________________________________________
http://tg-fibonacci-analysis.blogspot.com/
Recently I have started a blog where I’m using rather unconventional way to analyze and forecast future S/R of EUR/USD with Fibonacci retracement tool. Although in the blog I mainly concentrate on a daily chart I also use this method on 4h and 1h chart to forecast my targets.
I have attached my last post together with screenshot, hopefully that will make it slightly clearer what I’m up too. Please also look up the blog for more screenshots. I will do my best to keep this thread up to date.
I would appreciate any comments and constructive criticism.
Tom
http://4.bp.blogspot.com/-yFKX5L9faA...NU/s1600/4.gif
In the last few days our forecasted levels provided good support and resistance. Currently after a break out, 1.4797 level provided a good support and as long as this level holds we got a good potential for further rise. The next key resistance level is 1.4981, if the price will manage to break this level the next resistance is 1.5278. If the price will reach this level we will be expecting to see a pull back all the way back to the 1.4981. It is important to note that the stochastic has been overbought for an extended period of time on a daily and weekly time frame.
Knowing these we can play this setup in two ways. We can go long on the sustained break of 1.4981 targeting 1.5278. If the price will move too far on the breakout I would not advise to chase the trade and instead go long on a pull back. The second option is to go short from 1.5728 targeting 1.4981 level.
If you have any comments please do not hesitate to contact me. I will be more than happy to discuss any issues with you.
S/R Levels:
1.4649
1.4797
1.4981
1.5278
Tomasz Gdynia
[email protected]
____________________________________________
http://tg-fibonacci-analysis.blogspot.com/