Ok this trading strategy works as follows...
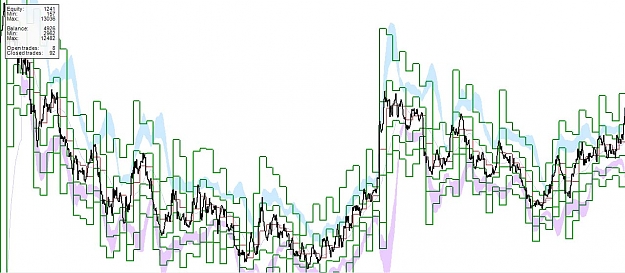
Every time a bollinger band is hit and a 4H candlestick closes below the upper bollinger band a short position is taken and all long positions are closed.
And opposite when the lower bolinger band is hit and a 4h candlestick closes above the lower band a long position is taken and all short positions are closed.
The simulation is done over a period of 3 months and all trades are of equal size.
First pic shows the bollinger bands.
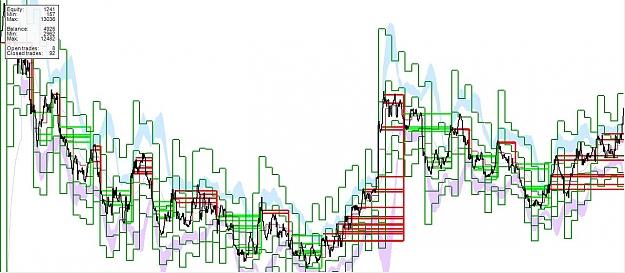
2nd pic shows the buy and sell pairs (red=short trade and green=long trade).
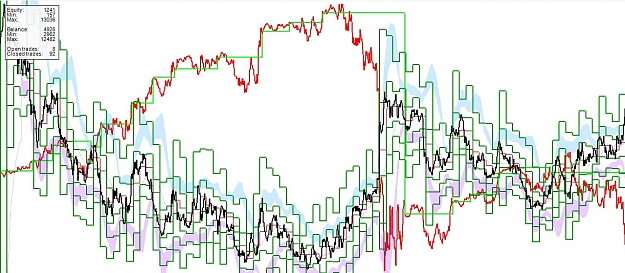
3rd pic shows the equity and balance.
The strategy actually works better then i expected.
Except for the mega trend in the middle there is stable profit.
I will try to find some rules where i can filter out these mega trends.
Every time a bollinger band is hit and a 4H candlestick closes below the upper bollinger band a short position is taken and all long positions are closed.
And opposite when the lower bolinger band is hit and a 4h candlestick closes above the lower band a long position is taken and all short positions are closed.
The simulation is done over a period of 3 months and all trades are of equal size.
First pic shows the bollinger bands.
2nd pic shows the buy and sell pairs (red=short trade and green=long trade).
3rd pic shows the equity and balance.
The strategy actually works better then i expected.
Except for the mega trend in the middle there is stable profit.
I will try to find some rules where i can filter out these mega trends.
Attached Image(s) (click to enlarge)