Hello everyone,
I have been evolving a scalping system on the GBP/JPY and believe it may be finished. I would like to continue to practice it and post my results here. It uses the 5-minute chart with heikin-ashi bars and resistance/support points like XXX.00, XXX.50 price levels and 100 SMA. Thus, I call it "Paul's 00 50 100 Scalping System".
Here are my results for the past 5 trading days. (Please note that my day job prevents me from looking at the charts for more than 4 or so hours a day so I am only able to get on 3 or 4 trades a day.)
Total trades: 17
Average trade duration: 12 minutes
Win rate: 84%
Average winning trade: 14.78 pips
Average losing trade: -7.37 pips
Pips won: 237
Pips lost: 22
Pips kept: 214 (90%)
Here is the full write up....
INTRODUCTION
When I first started forex I had a tendency to look only at small time frames like 1-minute or 5-minute charts. So by default my style was scalping. I found this very stressful and have since learned to trade on higher time frames like 1-hour and 4-hour. However, I still like to have a viable scalping system to use while I am waiting for a set up on the large charts. So I developed the system below to have a reliable approach that removed the stress element.
CHART SET UP
Currency pair – GBP/JPY. No other pair seems to react to the chart points mentioned below like this pair.
Timeframe – I find 5 minute charts to be the best in capturing trends for scalping.
Heikin-ashi –The purpose of using heikin-ashi bars is to limit the amount of information that goes into the entry and exit decision. When you are looking at candles, you are glued to the monitor to see what shape the candle will take or trying to identify candle patterns. Also, the color of candle charts changes from bar to bar. I find this the source of a lot of stress and, simply put, it is just too much information. With heikin-ashi charts, you are basically looking at the simple transfer of momentum between the bull camp and the bear camp. Yes, the wicks show you the high and low for the time period, but the body shape of the heikin-ashi tends to uniform and the color remains the same for many bars at a time. This allows you to stay on a good trend longer without getting too worried about jumpy price movement.
.00 and .50 price levels – For GBP/JPY, .00 and .50 price levels act as good support and resistance. In this system, these levels become entry points. To help me concentrate on these levels, I place an orange line over them on the chart.
100 SMA – I find on most current pairs that the 100 SMA also acts as support or resistance. It appears to be a big deal to move the price across the 100 SMA and the price often bounces off the SMA or at least a battle ensues between the bulls and the bears. This can also be an entry point in this system.
RSI (30, 70) – RSI is used as a confirmation for trade entry.
20, 30, 40 EMA – These averages are not essential to this system, but I do reference them when the price is in an extended move of an hour or more. When the price is on a good run, it sometimes bounces lightly off the 20 EMA and keeps going. This is an indication of a strong trend you should stay with you trade. The price also reacts to the 30 and 40 EMA sometimes. I consider it time to get out of a strong move when the price penetrates the 40 EMA.
BASIC SYSTEM
As we all know, oscillators (RSI, TSI, etc.) and moving average crosses are lagging indicators and do not allow you to efficiently grab pips. To effectively scalp, we need more reliable points on the chart for entry. We need to look for places on the chart where a price reversal or retracement is likely to happen. That means support or resistance either (1) on round numbers like .00 and .50 (and sometimes .80), (2) moving averages, and (3) occasionally chart points from high time frames like 1 hour, 4 hour, and day charts.
I find that GBP/JPY reacts extremely well to .00 and .50 price levels, sometimes the .80 price level, as well as the 100 SMA. Of course, this is not always the case. That is why I use the RSI for confirmation. The basic approach is to observe how the reacts near the points mentioned above and look for over-sold/over-bought signals (under 30 or over 70) on the RSI. If the price loses momentum and cannot pass the point of resistance or support AND the RSI is showing a signal, enter at this point in the opposite direction of the recent price movement.
THE TRADES
100 SMA reaction – When the price has been away from the 100 SMA for a while – let’s say at least 30 minutes – and comes back to it, it often reacts by bouncing off of it. Sometimes this bounce turns into an extended move. Even if it does not, you can grab 10 to 20 pips or at least get out without any serious damage. So when the price returns to the 100 SMA, check for over-bought/over-sold signals on the RSI, and place an order in the opposite direction of the price movement. For instance, if the price comes to the 100 SMA from above and the RSI is showing an over-sold sign, go long. (For stops and profit targets, see below.)
.00, .50, and .80 price level reaction – These price levels offer the opportunity for exactly the same entry. If the price approaches one of these levels and appears to be slowing down, check the RSI, and make an entry in the opposite direction.
New 5m high/new low – Here is an addition trade that has nothing to do with this system explained here but is extremely effective scalping method on GBY/JPY. When GBP/JPU makes a new high against the preceding high on the five minute (or a new low versus the preceding low) there is a high likely hood that it will move forward another 20 pips or so. So (in the case of a long entry) on the 5-minute chart, when the price looks like it will go above the most recent peak, place an entry order at a price point about 7 pips above the recent peak. This is a particularly good trade after the London open or when London and New York overlaps and an extended run appears.
STOP & PROFIT TARGET
I use a 20 pip stop loss on the GBP/JPY. It is nothing for the pound to retreat 15 pips and then charge forward 30 or 40 pips. When the trade moves positive by 10 to 15 pips, you may choose to move the stop to your entry. However, I sometimes find myself getting stopped out on a good trade this way so you may choose to maintain your original stop throughout the trade. Use your own judgment.
In the beginning, I suggest you use a 20 pip fixed price target in the beginning. When you get used to the heikin-ashi and have an idea of your win rate with this system, you may choose to take profit sooner or later. If you see the price is moving in the direction of your trade quickly, you can move your price target out to capture more profit.
COMMON SENSE
Even when scalping on a 5 minute chart, you have to be aware of support, resistance, trend, and channel lines, and obvious Fibonacci levels on higher charts as well as new daily highs and lows. So keep an eye on the higher time frames and draw your lines.
Also be aware of where you are in the hour. If you are used to looking at small time frames you know that the volatility tends to be high during certain parts of the hour especially around the close of the 30-minute bar and 10 minutes before the close of the hour bar. The close of the 4-hour bar is also a time to be careful of increased volatility. All this comes with experience.
FAQ
Q: Do you always wait for an RSI confirmation (above 70 or below 30)?
A: No. Sometimes conditions look so good for an entry that I get in when RSI is only at the 65/35 level.
Q: Do you have to wait for the price to touch the 100 SMA or the .00, .50, or .80 price levels?
A: No. I sometimes take the trade if the price goes within 5 pips. More than that is dangerous.
Q: What if the price passes the supposed point of support/resistance by 5 or 10 pips before stopping?
A: If it’s less than 10 pips, I usually take the trade. It is totally normal for the price to penetrate the SMA or XXX.00/XXX.50 price level by 5 pips or so. 10 or more pips would worry me.
Q: Does the color of the heikin-ashi bar matter for entry decisions?
A: Yes. But not in the way you might think. If you are anticipating going short, then you will be shorting at the top of a bullish bar. (Green bar on my chart.) You should not wait for the price to come down to enter the short trade. This is scalping and you need to be precise. Don’t chase trades. By the way, if you enter a short trade on a bullish bar and the next bar is still a bullish color, don’t worry. The price can hang out around the resistance for 10 to 15 minutes before falling.
Q: Isn’t the risk/reward on this system bad? 20 pip stop and a 20 pip price target?
A: Not if your win rate is good. If you scalp you need an excellent win rate…at least 70% if not 80 or 85%. If your win rate is good, you can survive by taking profit at 10 pips.
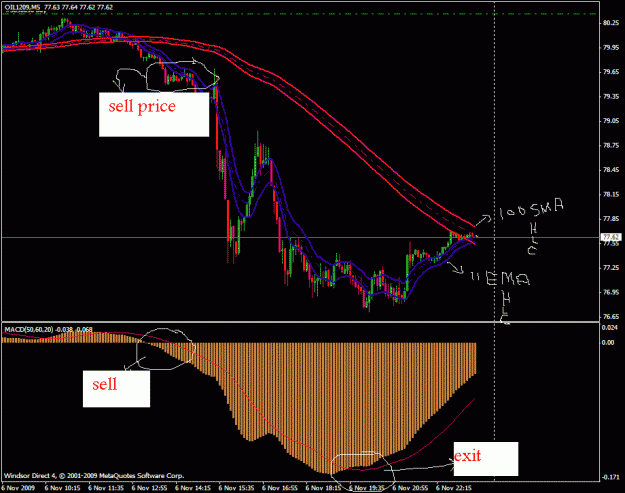
CHART NOTES
The attached chart shows some examples of trades.
http://i139.photobucket.com/albums/q...aulssystem.jpg
#1 – This is the perfect set-up. The price hits 148.50 and the RSI is showing over-bought. You could have easily grabbed at least 20 to 30 pips. And if you had some reason to believe the pound would be weak all day, you could have stuck with it for a max of 200 pips.
#2 – You probably would not enter here since the RSI is not showing over-sold. But this price dive is taking place mid-day in the Tokyo session where strong moves don’t usually occur. So you could have said, “this move isn’t for real” and gone long here.
#3 – Here also the RSI signal is not there. However, the 100 SMA and 148.00 price level converge. You might have taken this short on that basis. And it would have been a great trade.
#4 – Even before point 4 on the chart, the RSI has been showing over-sold for quite some time. This is not uncommon on a strong move. The challenge here is not to go counter trend too early. You have to look for some sign the run is slowing up. In this case, the proper trade is to go short with the trend when the price passes the preceding lows (see stars). Still the price does slow up and seems to react to the 146.80 price level. You could go long here for 20 pips.
#5 – Here is a more textbook case. The price hits 146.50, the RSI is over-sold, and we bounce cleanly off for a potential 50 pips.
I have been evolving a scalping system on the GBP/JPY and believe it may be finished. I would like to continue to practice it and post my results here. It uses the 5-minute chart with heikin-ashi bars and resistance/support points like XXX.00, XXX.50 price levels and 100 SMA. Thus, I call it "Paul's 00 50 100 Scalping System".
Here are my results for the past 5 trading days. (Please note that my day job prevents me from looking at the charts for more than 4 or so hours a day so I am only able to get on 3 or 4 trades a day.)
Total trades: 17
Average trade duration: 12 minutes
Win rate: 84%
Average winning trade: 14.78 pips
Average losing trade: -7.37 pips
Pips won: 237
Pips lost: 22
Pips kept: 214 (90%)
Here is the full write up....
INTRODUCTION
When I first started forex I had a tendency to look only at small time frames like 1-minute or 5-minute charts. So by default my style was scalping. I found this very stressful and have since learned to trade on higher time frames like 1-hour and 4-hour. However, I still like to have a viable scalping system to use while I am waiting for a set up on the large charts. So I developed the system below to have a reliable approach that removed the stress element.
CHART SET UP
Currency pair – GBP/JPY. No other pair seems to react to the chart points mentioned below like this pair.
Timeframe – I find 5 minute charts to be the best in capturing trends for scalping.
Heikin-ashi –The purpose of using heikin-ashi bars is to limit the amount of information that goes into the entry and exit decision. When you are looking at candles, you are glued to the monitor to see what shape the candle will take or trying to identify candle patterns. Also, the color of candle charts changes from bar to bar. I find this the source of a lot of stress and, simply put, it is just too much information. With heikin-ashi charts, you are basically looking at the simple transfer of momentum between the bull camp and the bear camp. Yes, the wicks show you the high and low for the time period, but the body shape of the heikin-ashi tends to uniform and the color remains the same for many bars at a time. This allows you to stay on a good trend longer without getting too worried about jumpy price movement.
.00 and .50 price levels – For GBP/JPY, .00 and .50 price levels act as good support and resistance. In this system, these levels become entry points. To help me concentrate on these levels, I place an orange line over them on the chart.
100 SMA – I find on most current pairs that the 100 SMA also acts as support or resistance. It appears to be a big deal to move the price across the 100 SMA and the price often bounces off the SMA or at least a battle ensues between the bulls and the bears. This can also be an entry point in this system.
RSI (30, 70) – RSI is used as a confirmation for trade entry.
20, 30, 40 EMA – These averages are not essential to this system, but I do reference them when the price is in an extended move of an hour or more. When the price is on a good run, it sometimes bounces lightly off the 20 EMA and keeps going. This is an indication of a strong trend you should stay with you trade. The price also reacts to the 30 and 40 EMA sometimes. I consider it time to get out of a strong move when the price penetrates the 40 EMA.
BASIC SYSTEM
As we all know, oscillators (RSI, TSI, etc.) and moving average crosses are lagging indicators and do not allow you to efficiently grab pips. To effectively scalp, we need more reliable points on the chart for entry. We need to look for places on the chart where a price reversal or retracement is likely to happen. That means support or resistance either (1) on round numbers like .00 and .50 (and sometimes .80), (2) moving averages, and (3) occasionally chart points from high time frames like 1 hour, 4 hour, and day charts.
I find that GBP/JPY reacts extremely well to .00 and .50 price levels, sometimes the .80 price level, as well as the 100 SMA. Of course, this is not always the case. That is why I use the RSI for confirmation. The basic approach is to observe how the reacts near the points mentioned above and look for over-sold/over-bought signals (under 30 or over 70) on the RSI. If the price loses momentum and cannot pass the point of resistance or support AND the RSI is showing a signal, enter at this point in the opposite direction of the recent price movement.
THE TRADES
100 SMA reaction – When the price has been away from the 100 SMA for a while – let’s say at least 30 minutes – and comes back to it, it often reacts by bouncing off of it. Sometimes this bounce turns into an extended move. Even if it does not, you can grab 10 to 20 pips or at least get out without any serious damage. So when the price returns to the 100 SMA, check for over-bought/over-sold signals on the RSI, and place an order in the opposite direction of the price movement. For instance, if the price comes to the 100 SMA from above and the RSI is showing an over-sold sign, go long. (For stops and profit targets, see below.)
.00, .50, and .80 price level reaction – These price levels offer the opportunity for exactly the same entry. If the price approaches one of these levels and appears to be slowing down, check the RSI, and make an entry in the opposite direction.
New 5m high/new low – Here is an addition trade that has nothing to do with this system explained here but is extremely effective scalping method on GBY/JPY. When GBP/JPU makes a new high against the preceding high on the five minute (or a new low versus the preceding low) there is a high likely hood that it will move forward another 20 pips or so. So (in the case of a long entry) on the 5-minute chart, when the price looks like it will go above the most recent peak, place an entry order at a price point about 7 pips above the recent peak. This is a particularly good trade after the London open or when London and New York overlaps and an extended run appears.
STOP & PROFIT TARGET
I use a 20 pip stop loss on the GBP/JPY. It is nothing for the pound to retreat 15 pips and then charge forward 30 or 40 pips. When the trade moves positive by 10 to 15 pips, you may choose to move the stop to your entry. However, I sometimes find myself getting stopped out on a good trade this way so you may choose to maintain your original stop throughout the trade. Use your own judgment.
In the beginning, I suggest you use a 20 pip fixed price target in the beginning. When you get used to the heikin-ashi and have an idea of your win rate with this system, you may choose to take profit sooner or later. If you see the price is moving in the direction of your trade quickly, you can move your price target out to capture more profit.
COMMON SENSE
Even when scalping on a 5 minute chart, you have to be aware of support, resistance, trend, and channel lines, and obvious Fibonacci levels on higher charts as well as new daily highs and lows. So keep an eye on the higher time frames and draw your lines.
Also be aware of where you are in the hour. If you are used to looking at small time frames you know that the volatility tends to be high during certain parts of the hour especially around the close of the 30-minute bar and 10 minutes before the close of the hour bar. The close of the 4-hour bar is also a time to be careful of increased volatility. All this comes with experience.
FAQ
Q: Do you always wait for an RSI confirmation (above 70 or below 30)?
A: No. Sometimes conditions look so good for an entry that I get in when RSI is only at the 65/35 level.
Q: Do you have to wait for the price to touch the 100 SMA or the .00, .50, or .80 price levels?
A: No. I sometimes take the trade if the price goes within 5 pips. More than that is dangerous.
Q: What if the price passes the supposed point of support/resistance by 5 or 10 pips before stopping?
A: If it’s less than 10 pips, I usually take the trade. It is totally normal for the price to penetrate the SMA or XXX.00/XXX.50 price level by 5 pips or so. 10 or more pips would worry me.
Q: Does the color of the heikin-ashi bar matter for entry decisions?
A: Yes. But not in the way you might think. If you are anticipating going short, then you will be shorting at the top of a bullish bar. (Green bar on my chart.) You should not wait for the price to come down to enter the short trade. This is scalping and you need to be precise. Don’t chase trades. By the way, if you enter a short trade on a bullish bar and the next bar is still a bullish color, don’t worry. The price can hang out around the resistance for 10 to 15 minutes before falling.
Q: Isn’t the risk/reward on this system bad? 20 pip stop and a 20 pip price target?
A: Not if your win rate is good. If you scalp you need an excellent win rate…at least 70% if not 80 or 85%. If your win rate is good, you can survive by taking profit at 10 pips.
CHART NOTES
The attached chart shows some examples of trades.
http://i139.photobucket.com/albums/q...aulssystem.jpg
#1 – This is the perfect set-up. The price hits 148.50 and the RSI is showing over-bought. You could have easily grabbed at least 20 to 30 pips. And if you had some reason to believe the pound would be weak all day, you could have stuck with it for a max of 200 pips.
#2 – You probably would not enter here since the RSI is not showing over-sold. But this price dive is taking place mid-day in the Tokyo session where strong moves don’t usually occur. So you could have said, “this move isn’t for real” and gone long here.
#3 – Here also the RSI signal is not there. However, the 100 SMA and 148.00 price level converge. You might have taken this short on that basis. And it would have been a great trade.
#4 – Even before point 4 on the chart, the RSI has been showing over-sold for quite some time. This is not uncommon on a strong move. The challenge here is not to go counter trend too early. You have to look for some sign the run is slowing up. In this case, the proper trade is to go short with the trend when the price passes the preceding lows (see stars). Still the price does slow up and seems to react to the 146.80 price level. You could go long here for 20 pips.
#5 – Here is a more textbook case. The price hits 146.50, the RSI is over-sold, and we bounce cleanly off for a potential 50 pips.