Hi mates 
I have been testing the following three strategies for some time and I am very pleased with the accuracy of the results. Basically, you can use each strategy alone, but by combining the three together you are creating a powerful trading weapon.
Legend of the charts:
- Distance between two orange horizontal line: pips profit
- Orange arrow: Buy entry
- Crossed orange arrow: Exit Buy position
- Blue arrow: Sell entry
- Crossed blue arrow: Exit Sell position
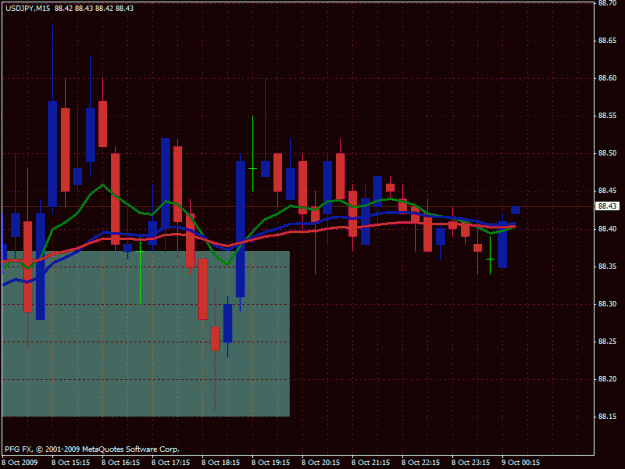
Strategy #1 : Moving average crosses
For this strategy we need three moving averages:
- Period: 10 (Exponential moving average)
- Period: 25 (Exponential moving average)
- Period: 50 (Exponential moving average)
http://img381.imageshack.us/img381/1788/emas.jpg
Entry rule: When the 10 EMA crosses the 25 EMA, it shows a bullish/bearish trend (direction of the crossing). However to avoid a false signal, you might wait until the 10 EMA crosses the 50 EMA, at that point you enter.
Exit rule: It's basically the same rule, you close your position, when the 10 EMA crosses agan the 50 EMA
- - - - - - - - - -
EXAMPLE CHART
- - - - - - - - - -
I've used today's chart (EUR/USD , 15min), to show you how I made my today's profit
You can see how in the area of the orange arrow, the 10 EMA crosses the 25 EMA and then continues and crosses the 50 EMA. At that point you enter with a BUY position. Later on, you can see how the distance between the EMA's become smaller and eventually the curves cross again, at that point you close your position.
Strategy #2 : MACD & SAR
For this strategy we need two indicators with the following settings:
- MACD (12, 26, 9)
- Parabolic SAR (0.02, 0.2)
http://img195.imageshack.us/img195/3324/macdsar.jpg
Entry rule: When the MACD lines cross and there is a new signal from the Parabolic SAR, you open a trade position.
Exit rule: It's basically the opposite of the entry rule. When again the MACD lines cross and there is a new signal from the Parabolic SAR, you close your trade position.
- - - - - - - - - -
EXAMPLE CHART
- - - - - - - - - -
I've used again today's chart (EUR/USD , 30min), to show how I confirmed my entry position with the second strategy.
You can see how in the area of the orange arrow, the MACD lines cross and there is a BUY signal from the Parabolic SAR (before the SAR was giving selling signals), at that point you enter with a BUY position. Later on, MACD lines cross again, and we can see how the SAR give us a selling signal, at that point you close your position.
PS: We can observe how the SAR actually changes three times its signal (BUY, SELL, BUY) before closing the position. However the MACD filters those false premature signals of closing position. That's also way by combining the 3 strategies together you are maximizing your profits by filtering the false signals.
Strategy #3 : ADX & EMA's & SAR
For this strategy we four indicators with the following settings:
- ADX (50)
- Parabolic SAR (0.02, 0.2)
- Period: 3 (Exponential moving average)
- Period: 10 (Exponential moving average)
http://img201.imageshack.us/img201/6/adxemas.jpg
Entry rule: When the DI+ line of the ADX is higher than the DI- line, when the SAR is giving a new trading signal and when the 3 EMA crosses the 10 EMA, you open a BUY position (if DI+ is below the DI- and the 3 EMA crosses the 10 EMA from above, it's a SELL signal)
Exit rule: When the DI+ and the DI- cross again, the SAR gives a new signal and the EMA's cross.
- - - - - - - - - -
EXAMPLE CHART
- - - - - - - - - -
Again, it's the same chart (EUR/USD , 15min):
You can see how in the area of the orange arrow all the conditions of entry are respected. Therefore, we enter with a BUY position. However, the exit position is a little bit ambiguous with this strategy. I've spotted two levels of closing position. The first one (top one) is the profit maximizing position, and the level above, is the less profitable closing position. If we follow the rules of exit we won't have the optimal profit (second level of exit). However, if you combine the three strategies together and maybe add the RSI you will end up in the higher exit level
PS: Again we can see how during the opened position, the SAR and the EMA's give false signal, but you can easily filter them with the ADX.
The three strategies are quite powerful and give good results (personal experience), that's why I post them here. In combination they are creating a very powerful trading weapon. Of course, I can't guarantee you that they will always give you perfect results.
Enjoy!
I have been testing the following three strategies for some time and I am very pleased with the accuracy of the results. Basically, you can use each strategy alone, but by combining the three together you are creating a powerful trading weapon.
Legend of the charts:
- Distance between two orange horizontal line: pips profit
- Orange arrow: Buy entry
- Crossed orange arrow: Exit Buy position
- Blue arrow: Sell entry
- Crossed blue arrow: Exit Sell position
Strategy #1 : Moving average crosses
For this strategy we need three moving averages:
- Period: 10 (Exponential moving average)
- Period: 25 (Exponential moving average)
- Period: 50 (Exponential moving average)
http://img381.imageshack.us/img381/1788/emas.jpg
Entry rule: When the 10 EMA crosses the 25 EMA, it shows a bullish/bearish trend (direction of the crossing). However to avoid a false signal, you might wait until the 10 EMA crosses the 50 EMA, at that point you enter.
Exit rule: It's basically the same rule, you close your position, when the 10 EMA crosses agan the 50 EMA
- - - - - - - - - -
EXAMPLE CHART
- - - - - - - - - -
I've used today's chart (EUR/USD , 15min), to show you how I made my today's profit
You can see how in the area of the orange arrow, the 10 EMA crosses the 25 EMA and then continues and crosses the 50 EMA. At that point you enter with a BUY position. Later on, you can see how the distance between the EMA's become smaller and eventually the curves cross again, at that point you close your position.
Strategy #2 : MACD & SAR
For this strategy we need two indicators with the following settings:
- MACD (12, 26, 9)
- Parabolic SAR (0.02, 0.2)
http://img195.imageshack.us/img195/3324/macdsar.jpg
Entry rule: When the MACD lines cross and there is a new signal from the Parabolic SAR, you open a trade position.
Exit rule: It's basically the opposite of the entry rule. When again the MACD lines cross and there is a new signal from the Parabolic SAR, you close your trade position.
- - - - - - - - - -
EXAMPLE CHART
- - - - - - - - - -
I've used again today's chart (EUR/USD , 30min), to show how I confirmed my entry position with the second strategy.
You can see how in the area of the orange arrow, the MACD lines cross and there is a BUY signal from the Parabolic SAR (before the SAR was giving selling signals), at that point you enter with a BUY position. Later on, MACD lines cross again, and we can see how the SAR give us a selling signal, at that point you close your position.
PS: We can observe how the SAR actually changes three times its signal (BUY, SELL, BUY) before closing the position. However the MACD filters those false premature signals of closing position. That's also way by combining the 3 strategies together you are maximizing your profits by filtering the false signals.
Strategy #3 : ADX & EMA's & SAR
For this strategy we four indicators with the following settings:
- ADX (50)
- Parabolic SAR (0.02, 0.2)
- Period: 3 (Exponential moving average)
- Period: 10 (Exponential moving average)
http://img201.imageshack.us/img201/6/adxemas.jpg
Entry rule: When the DI+ line of the ADX is higher than the DI- line, when the SAR is giving a new trading signal and when the 3 EMA crosses the 10 EMA, you open a BUY position (if DI+ is below the DI- and the 3 EMA crosses the 10 EMA from above, it's a SELL signal)
Exit rule: When the DI+ and the DI- cross again, the SAR gives a new signal and the EMA's cross.
- - - - - - - - - -
EXAMPLE CHART
- - - - - - - - - -
Again, it's the same chart (EUR/USD , 15min):
You can see how in the area of the orange arrow all the conditions of entry are respected. Therefore, we enter with a BUY position. However, the exit position is a little bit ambiguous with this strategy. I've spotted two levels of closing position. The first one (top one) is the profit maximizing position, and the level above, is the less profitable closing position. If we follow the rules of exit we won't have the optimal profit (second level of exit). However, if you combine the three strategies together and maybe add the RSI you will end up in the higher exit level
PS: Again we can see how during the opened position, the SAR and the EMA's give false signal, but you can easily filter them with the ADX.
The three strategies are quite powerful and give good results (personal experience), that's why I post them here. In combination they are creating a very powerful trading weapon. Of course, I can't guarantee you that they will always give you perfect results.
Enjoy!
{Promotion Removed}