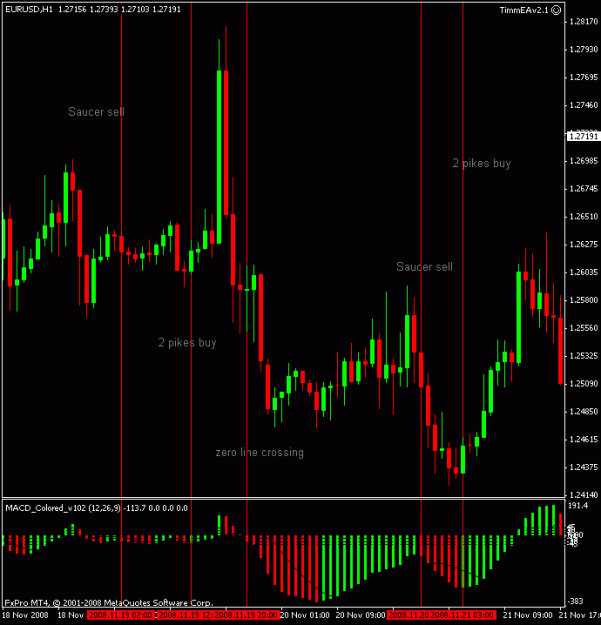
Using MACD coloured (settings 12, 26, 9) does anyone know if this is available or is it possible to write a simple alert EA (ie provides an alert but not necessarily full trades) using closed candles that would comprise:
Signals to buy
Saucer
This signal to buy that comes when the MACD bar chart is higher than the zero line. One must bear in mind:
§ the saucer signal is generated when the bar chart reversed its direction from the downward to upward. The second column is lower than the first one and is colored red. The third column is higher than the second and is colored green.
§ for the saucer signal to be generated the bar chart should have at least three columns. It could have had many more however.
Keep in mind, all MACD columns should be over the zero line for the saucer signal to be used. There must be a change in colour from red to green.
Zero line crossing
The signal to buy is generated when the bar chart passes from the area of negative values to that of positive. It comes when the bar chart crosses the zero line. As regards this signal:
§ for this signal to be generated, only two columns are necessary;
§ the first column is to be below the zero line, the second one is to cross it (transition from a negative value to a positive one);
§ simultaneous generation of signals to buy and to sell is impossible.
Two pikes
This is the only signal to buy that can be generated when the bar chart values are below the zero line. As regards this signal, please, bear in mind:
§ the signal is generated, when you have a pike pointing down (the lowest minimum) which is below the zero line and is followed by another down-pointing pike which is somewhat higher (a negative figure with a lesser absolute value, which is therefore closer to the zero line), than the previous down-looking pike. There must be a change in colour from red to green.
§ the bar chart is to be below the zero line between the two pikes. If the bar chart crosses the zero line in the section between the pikes, the signal to buy doesn’t function. However, a different signal to buy will be generated — zero line crossing.
§
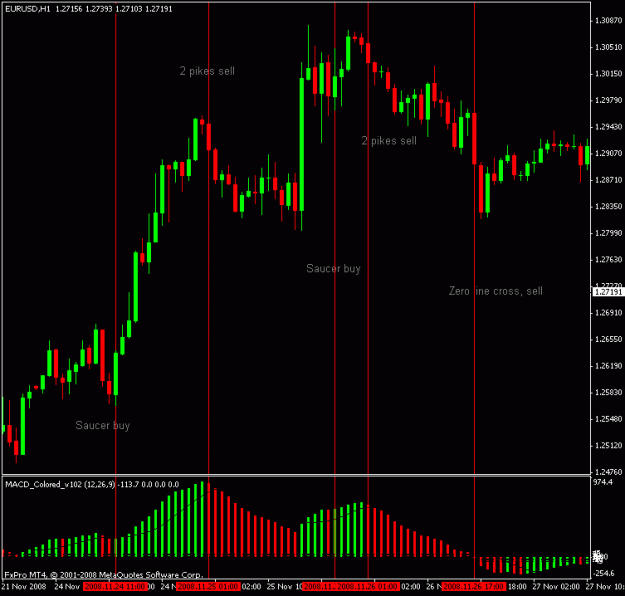
Signals to sell
Signals to sell are identical reversals of the signals to buy. The saucer signal is reversed and is below zero. There must be a change in colour from green to red.
Zero line crossing is on the decrease — the first column of it is over the zero, the second one is under it.
The two pikes sell signal, the bars are higher than the zero line and is reversed too. There must be a change in colour from green to red.
I have attached some examples.
Signals to buy
Saucer
This signal to buy that comes when the MACD bar chart is higher than the zero line. One must bear in mind:
§ the saucer signal is generated when the bar chart reversed its direction from the downward to upward. The second column is lower than the first one and is colored red. The third column is higher than the second and is colored green.
§ for the saucer signal to be generated the bar chart should have at least three columns. It could have had many more however.
Keep in mind, all MACD columns should be over the zero line for the saucer signal to be used. There must be a change in colour from red to green.
Zero line crossing
The signal to buy is generated when the bar chart passes from the area of negative values to that of positive. It comes when the bar chart crosses the zero line. As regards this signal:
§ for this signal to be generated, only two columns are necessary;
§ the first column is to be below the zero line, the second one is to cross it (transition from a negative value to a positive one);
§ simultaneous generation of signals to buy and to sell is impossible.
Two pikes
This is the only signal to buy that can be generated when the bar chart values are below the zero line. As regards this signal, please, bear in mind:
§ the signal is generated, when you have a pike pointing down (the lowest minimum) which is below the zero line and is followed by another down-pointing pike which is somewhat higher (a negative figure with a lesser absolute value, which is therefore closer to the zero line), than the previous down-looking pike. There must be a change in colour from red to green.
§ the bar chart is to be below the zero line between the two pikes. If the bar chart crosses the zero line in the section between the pikes, the signal to buy doesn’t function. However, a different signal to buy will be generated — zero line crossing.
§
Signals to sell
Signals to sell are identical reversals of the signals to buy. The saucer signal is reversed and is below zero. There must be a change in colour from green to red.
Zero line crossing is on the decrease — the first column of it is over the zero, the second one is under it.
The two pikes sell signal, the bars are higher than the zero line and is reversed too. There must be a change in colour from green to red.
I have attached some examples.
Attached Image(s) (click to enlarge)
Attached File(s)