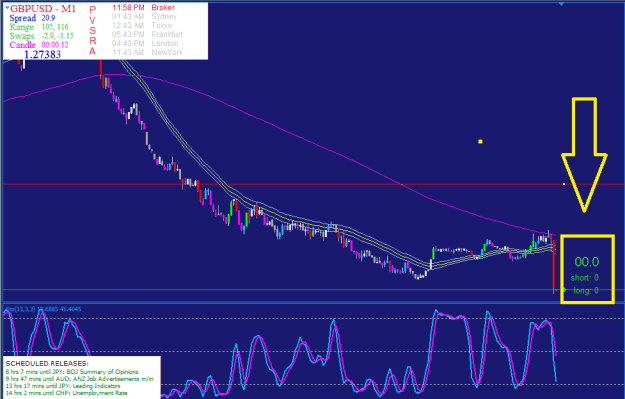
P = Price
V = Volume
S = Support
R = Resistence
A = Analysis
You can read about PVSRA in this 2 thread :
1º: PVSRA (Price, Volume, S&R Analysis) by Traderathome
link: https://www.forexfactory.com/thread/...me-sr-analysis
2º: PVSRA Scalping with Cigarguy
link: https://www.forexfactory.com/thread/...-with-cigarguy
If have 2 threads about the PVSRA, why you will create another thread ?
- Because the PVSRA is the base of all studies about graphic analysis. But here, the base of our studies will be the Analysis, from the analysis we have the points of support and resistence. And the indicators will show the correct time of the price action and volume.
------------------------------------------------------------------------------
This thread is for you start the studies or to fix some mistake that you have in your operational, and for that do it, we will trade small with some challenges:
1º week - stage 1;
- Only 1 trade with 0.05 lot
- You need to use stop loss
- You need to finish the week with profit.
- You can't open any trade between the last 4 hours and the first 4 hours of every day.
- Not trade gap.
- Not trade divergence.
Good Luck in your first week;
2º week - stage 2;
- Change the levels of fibo to -1.5, -1, 0, 1, 2. And use the risk/return 1:2.
- level -1.5 = stop loss;
- level -1 = none;
- level 0 = none;
- level 1 = Target 1;
- level 2 = Target 2;
- Draw the fibo using a small movement or a good candle;
- Open 2 trades and move the level 0 of fibo to the trade and place the stop loss and target;
- After close, you can't open any trade for at least 1 hour.
------------------------------------------------------------------------------
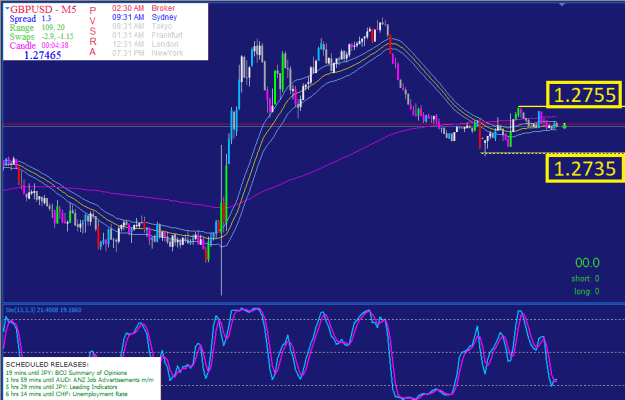
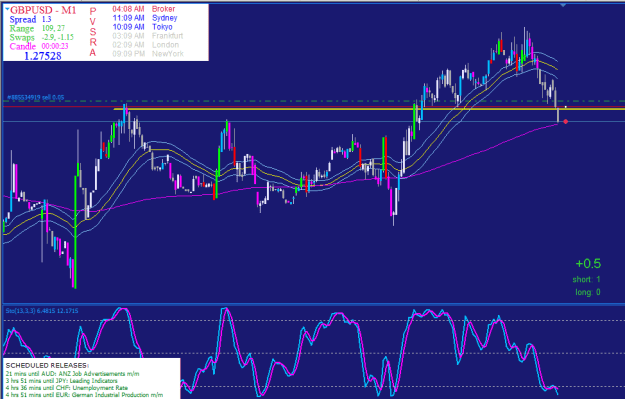
How to trade using this template ?
- Scalping with the chart M1;
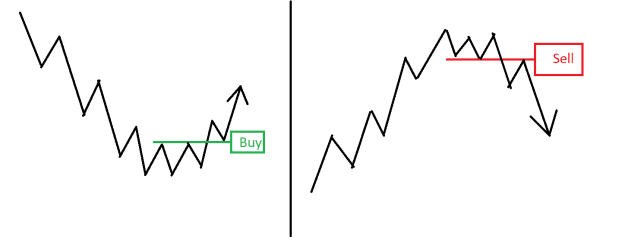
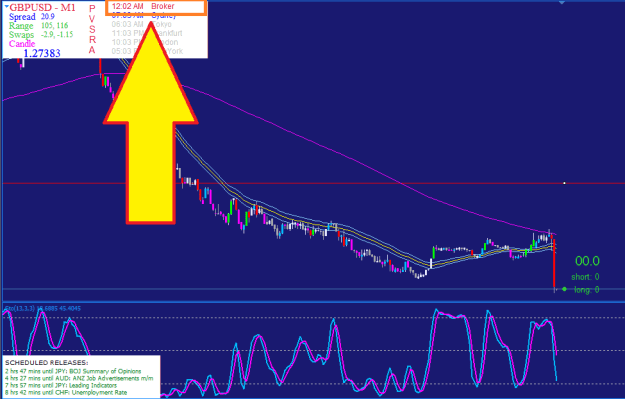
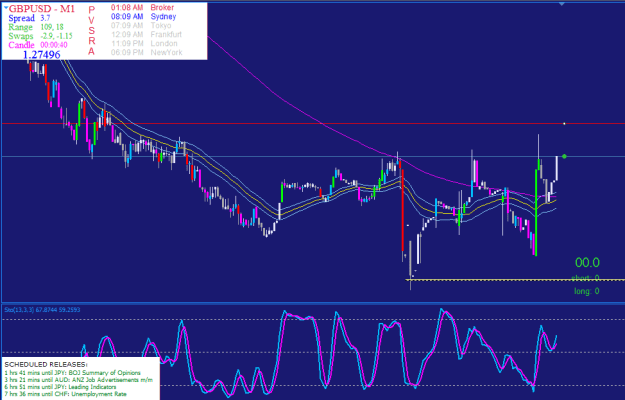
- Buy :
- wait the price to cross above the MA and the last top;
- wait for a consolidation above the MA;
- buy the breakout;
- place the stop loss below the bottom;
- target = Stochastic - level 20;
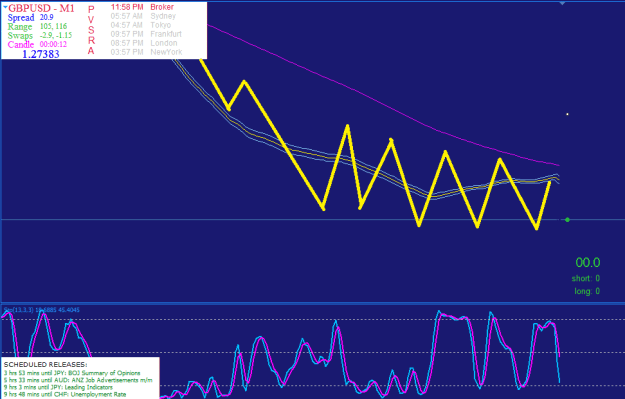
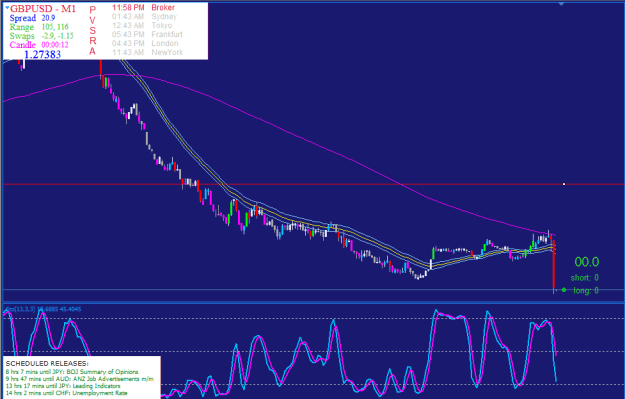
- Sell ;
- wait the price cross below the MA and below of the last bottom;
- wait for a consolidation below of the MA;
- sell the breakout;
- place the stop loss above the top;
- target = Stochastic - level 80;
- In the post #5, have the links with some examples of the trades;
- #Post the entry and exits of the trades;
- #Posts with only trades closed not are valid and not have relevance in this thread;
------------------------------------------------------------------------------
V = Volume
S = Support
R = Resistence
A = Analysis
You can read about PVSRA in this 2 thread :
1º: PVSRA (Price, Volume, S&R Analysis) by Traderathome
link: https://www.forexfactory.com/thread/...me-sr-analysis
2º: PVSRA Scalping with Cigarguy
link: https://www.forexfactory.com/thread/...-with-cigarguy
If have 2 threads about the PVSRA, why you will create another thread ?
- Because the PVSRA is the base of all studies about graphic analysis. But here, the base of our studies will be the Analysis, from the analysis we have the points of support and resistence. And the indicators will show the correct time of the price action and volume.
------------------------------------------------------------------------------
This thread is for you start the studies or to fix some mistake that you have in your operational, and for that do it, we will trade small with some challenges:
1º week - stage 1;
- Only 1 trade with 0.05 lot
- You need to use stop loss
- You need to finish the week with profit.
- You can't open any trade between the last 4 hours and the first 4 hours of every day.
- Not trade gap.
- Not trade divergence.
Good Luck in your first week;
2º week - stage 2;
- Change the levels of fibo to -1.5, -1, 0, 1, 2. And use the risk/return 1:2.
- level -1.5 = stop loss;
- level -1 = none;
- level 0 = none;
- level 1 = Target 1;
- level 2 = Target 2;
- Draw the fibo using a small movement or a good candle;
- Open 2 trades and move the level 0 of fibo to the trade and place the stop loss and target;
- After close, you can't open any trade for at least 1 hour.
------------------------------------------------------------------------------
How to trade using this template ?
- Scalping with the chart M1;
- Buy :
- wait the price to cross above the MA and the last top;
- wait for a consolidation above the MA;
- buy the breakout;
- place the stop loss below the bottom;
- target = Stochastic - level 20;
- Sell ;
- wait the price cross below the MA and below of the last bottom;
- wait for a consolidation below of the MA;
- sell the breakout;
- place the stop loss above the top;
- target = Stochastic - level 80;
- In the post #5, have the links with some examples of the trades;
- #Post the entry and exits of the trades;
- #Posts with only trades closed not are valid and not have relevance in this thread;
------------------------------------------------------------------------------
Attached Image (click to enlarge)
Attached File(s)
Attached File(s)
Attached File(s)
Attached File(s)
Attached File(s)
Attached File(s)
Together we can be strongest