i was watching intraday price action in real time for many days and see this phenomenon happens over and over again.
Correlated pairs tend to move in parallel, or rymes with each other, cycle by cycle. XXX/USD goes up when YYY/USD goes up, XXX/USD down when YYY/USD down. It makes sense since the Dollar on one side.
But the interesting thing is the magnitude of these movement is different.
The trend of these pairs is often follow (and be opposite) with the Dollar. So it is only Up OR Down at one moment. But the difference in liquidity condition of XXX and YYY sometimes responsible for the difference of movement's magnitude and thus, the illusion about divergent trend on similar pairs.
Before finding a way to exploit this phenomenon, we need to ask which reason causes this divergence.
It's Liquidity!
Every market technically moves because of the interaction between market order and Limit pending order. Market order pushes market into the prevailing direction, suck Liquidity out of the market while Limit order provides Liquidity to the market. Thus, market order is like hitting gas pedal while Limit order is like speedbump/barrier.
Think about housing market. They said it's illiquid at the time of crisis because there is so much firesale (as sell market order, sell at whatever market price/ or sell stop: Sell at market price to cut loss and pay debt) and less buyer (as Buy limit order to stop price falling).
*Note that people often talk about Liquidity as quickly to convert into cash (Sell side) when talking about investing assets. For currency trading, we talk about Liquidity on both Buy/Sell Side.
Suppose 2 pairs are still in overall uptrend due to USD weakness => Bullish sentiment with Buy limit order built up below current price. Thus, any temporary downward move will face great Buying pressure.
While they share the same overall direction due to the Dollar, each currency (XXX and YYY) has its own supply/demand on the market. One may have more demand vs the other.
So we have a sudden sell-off on both pairs due to temporary strengh of Dollar. With different conditions of Liquidity (Demand in this case), Buy Limit order on YYY/USD pair at previous swing low is broken while on XXX/USD is not. Thus, we can see Lower Low on price chart on YYY/USD - very easy mistake with broken structure.
But Price action, market structure on chart is just the appearance, not the reason behind. Orders are the reason behind. Seeing technical market structure broke on chart doesn't mean the trend is over. The uptrend is over when overall market participant's sentiment switch to Bearish (or at least stop Bullish) and mass amount of Liquidity (in this case as Demand - Buy Limit order) be absorbed or cancelled out.
Using currency pair divergence to read big order on price chart
Every movement in market is searching for liquidity. Exploiting the divergence between similar currency pairs could help us detect where is Big Limit order located.
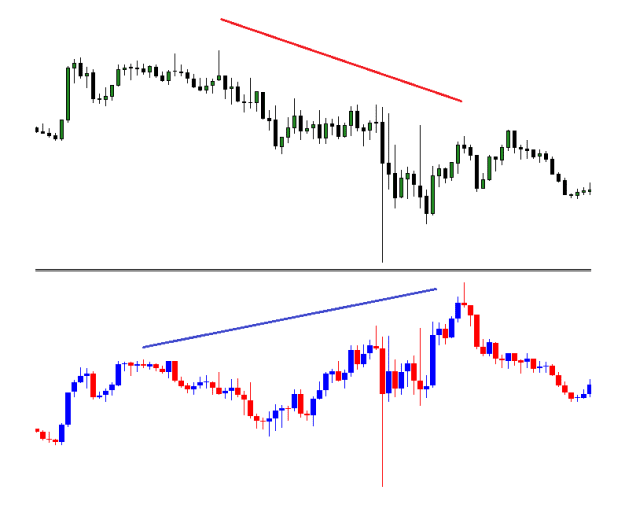
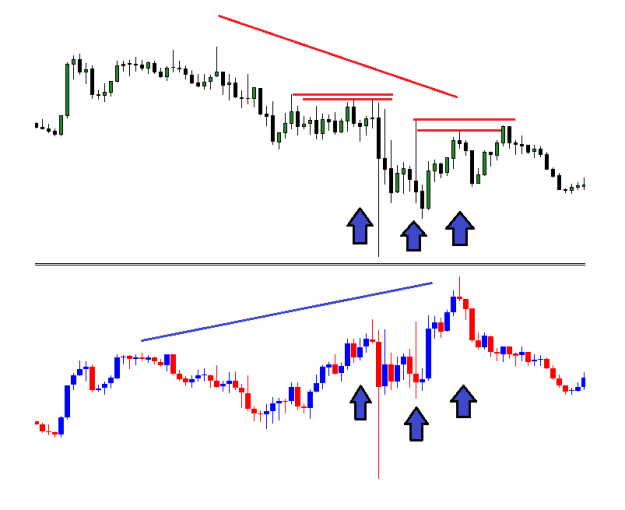
First glance, we can see the different between EUR/USD (above) and GBP/USD (below). EU seem to lean downward and GU lean upward. Of course they are correlated and share the same overall trend afterall, and they move in tandem. But why the divergence?
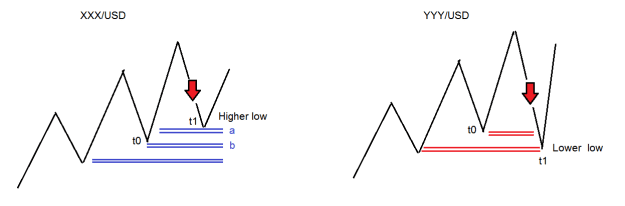
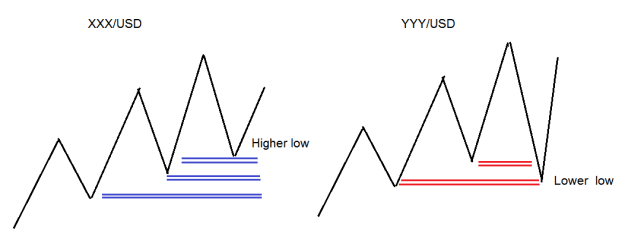
Because they move in tandem, then XXX/USD and YYY/USD both create a swing low at same time t0. After t0, new demand was built up above the t0 swing low on XXX/USD (at level a). Same with YYY/USD. But only new demand on XXX/USD be able to stop the falling market at time t1.
The downmove is the one which reveal where is liquidity - big Limit order on XXX/USD pair. We can clearly see it after time t1.
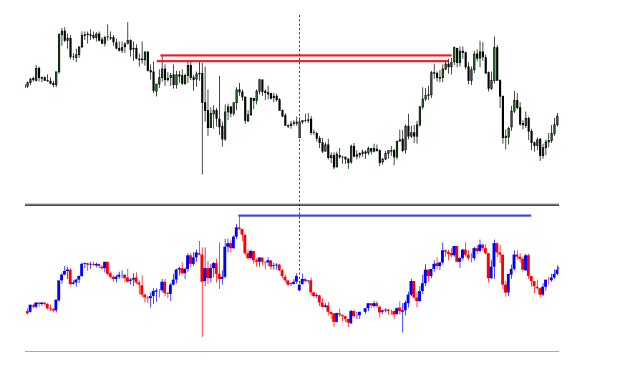
Everytime the market rally (as Dollar sell off), GBP/USD make Higher high, while EUR/USD cannot.
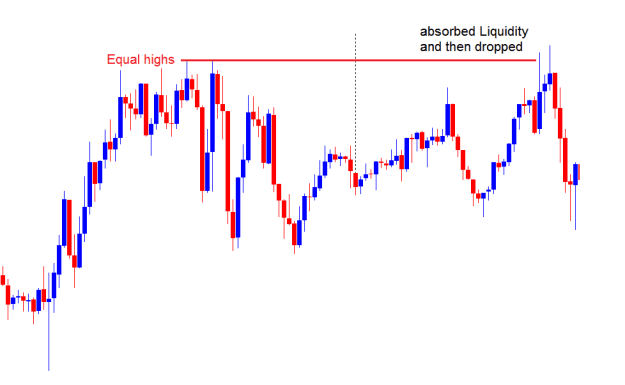
In fact, just by simply looking at it, anyone could see there is clear Limit order on EUR/USD that stop this pair to the upside. Better, we can also see equal highs as the level was tested multiple time as this Limit order cluster was partially absorbed, but still there.
The Dollar sell market order is the one pushed both pair to the upside. This move is the one reveal where Liquidity's located on EUR/USD.
Moving forward, market just rallied above the Liquidity level above EUR/USD equal highs and then dropped afterward.
We can also see divergence again. But in this case, the EUR/USD made Higher high while GBP/USD could not (vs previous day's swing high at similar time).
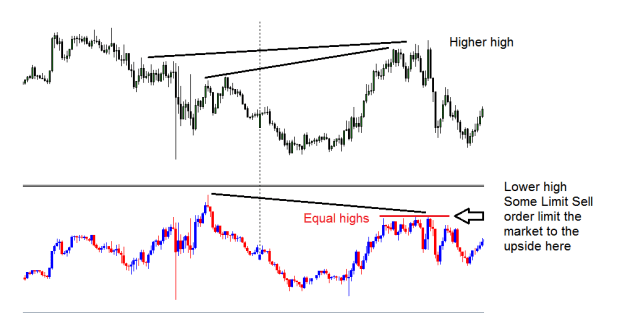
Once again, moving forward, we have the same price action on GBP/USD the day after
Correlated pairs tend to move in parallel, or rymes with each other, cycle by cycle. XXX/USD goes up when YYY/USD goes up, XXX/USD down when YYY/USD down. It makes sense since the Dollar on one side.
But the interesting thing is the magnitude of these movement is different.
The trend of these pairs is often follow (and be opposite) with the Dollar. So it is only Up OR Down at one moment. But the difference in liquidity condition of XXX and YYY sometimes responsible for the difference of movement's magnitude and thus, the illusion about divergent trend on similar pairs.
Attached Image (click to enlarge)
Before finding a way to exploit this phenomenon, we need to ask which reason causes this divergence.
It's Liquidity!
Every market technically moves because of the interaction between market order and Limit pending order. Market order pushes market into the prevailing direction, suck Liquidity out of the market while Limit order provides Liquidity to the market. Thus, market order is like hitting gas pedal while Limit order is like speedbump/barrier.
Think about housing market. They said it's illiquid at the time of crisis because there is so much firesale (as sell market order, sell at whatever market price/ or sell stop: Sell at market price to cut loss and pay debt) and less buyer (as Buy limit order to stop price falling).
*Note that people often talk about Liquidity as quickly to convert into cash (Sell side) when talking about investing assets. For currency trading, we talk about Liquidity on both Buy/Sell Side.
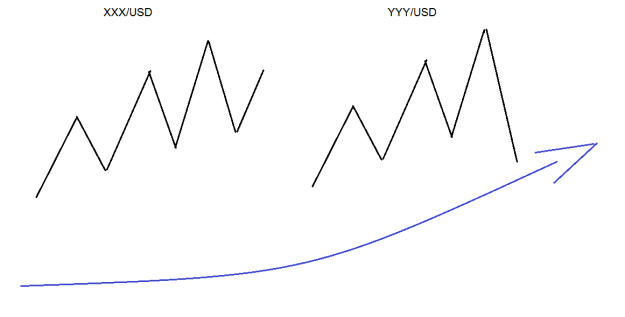
Suppose 2 pairs are still in overall uptrend due to USD weakness => Bullish sentiment with Buy limit order built up below current price. Thus, any temporary downward move will face great Buying pressure.
Attached Image (click to enlarge)
While they share the same overall direction due to the Dollar, each currency (XXX and YYY) has its own supply/demand on the market. One may have more demand vs the other.
Attached Image (click to enlarge)
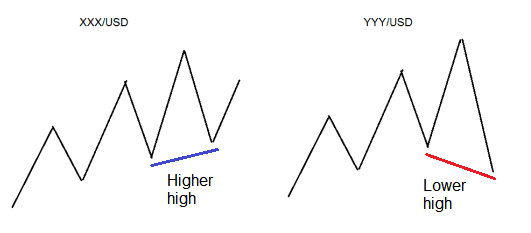
So we have a sudden sell-off on both pairs due to temporary strengh of Dollar. With different conditions of Liquidity (Demand in this case), Buy Limit order on YYY/USD pair at previous swing low is broken while on XXX/USD is not. Thus, we can see Lower Low on price chart on YYY/USD - very easy mistake with broken structure.
But Price action, market structure on chart is just the appearance, not the reason behind. Orders are the reason behind. Seeing technical market structure broke on chart doesn't mean the trend is over. The uptrend is over when overall market participant's sentiment switch to Bearish (or at least stop Bullish) and mass amount of Liquidity (in this case as Demand - Buy Limit order) be absorbed or cancelled out.
Using currency pair divergence to read big order on price chart
Every movement in market is searching for liquidity. Exploiting the divergence between similar currency pairs could help us detect where is Big Limit order located.
Attached Image (click to enlarge)
Attached Image (click to enlarge)
The downmove is the one which reveal where is liquidity - big Limit order on XXX/USD pair. We can clearly see it after time t1.
Attached Image (click to enlarge)
Everytime the market rally (as Dollar sell off), GBP/USD make Higher high, while EUR/USD cannot.
In fact, just by simply looking at it, anyone could see there is clear Limit order on EUR/USD that stop this pair to the upside. Better, we can also see equal highs as the level was tested multiple time as this Limit order cluster was partially absorbed, but still there.
The Dollar sell market order is the one pushed both pair to the upside. This move is the one reveal where Liquidity's located on EUR/USD.
Attached Image (click to enlarge)
We can also see divergence again. But in this case, the EUR/USD made Higher high while GBP/USD could not (vs previous day's swing high at similar time).
Attached Image (click to enlarge)
Once again, moving forward, we have the same price action on GBP/USD the day after
Attached Image (click to enlarge)