Hello everybody.
I was sick of watching candles and formations forever. I have been interested in dashboard trading for a long time and use some indicators that were developed by users from this great forum.
Do you know that? Someone who matters coughs or says something meaningful or not meaningful and courses respond immediately? How was it with Ronaldo when he said he should drink more water and not cola and the cola price lost about 1.8 billion dollars in value? A footballer? If something like that is already possible then I don't need any more candles strategy and formations. Or how was it with elon musk and the DOGE Coin, which is known and recognized as a pure fake? For example, he posts a dog that smiles and the coin shoots upwards. crazy shit how peoples in good positions with many followers make money from nothing.
We are trading in a crazy market and this "cough" as I call it is increasingly used to give currencies a certain nudge in the desired direction.
Every official and insider news, true or false, affects the markets.
But now I come to the idea and the template what I have put together from the indicators and ask whether some would like to discuss it.
I put it together according to a 6 point plan and try to learn from previous wrong approaches.
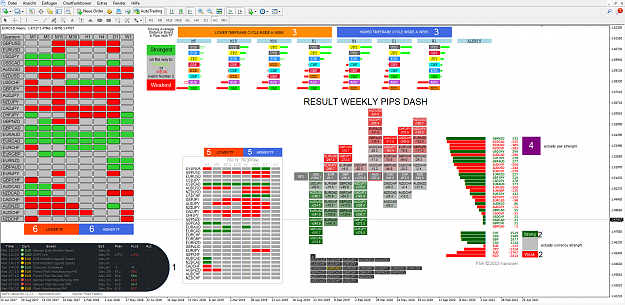
I post 2 pictures immediately after this opening post.
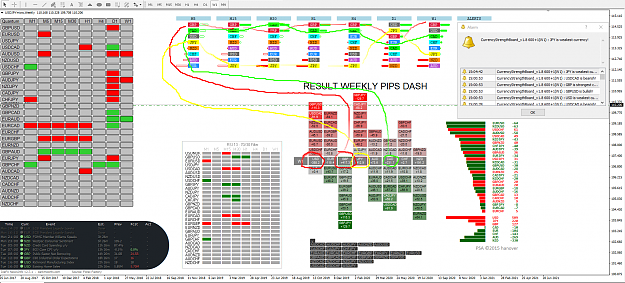
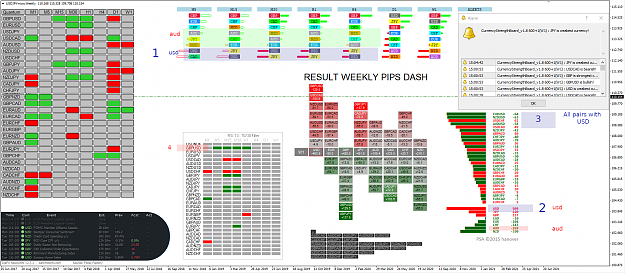
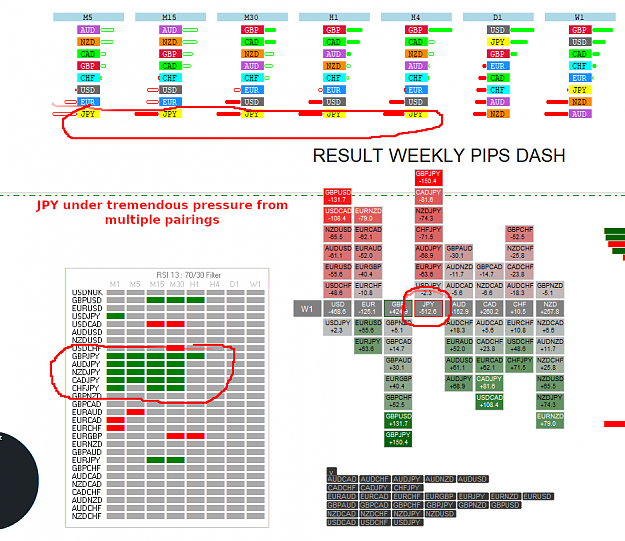
I am interested in recognizing fundamental news and the changes between the individual currencies. So not really new so far. Fundamental data are therefore always in the first place with me to see why some currencies are getting weaker and others are getting stronger.
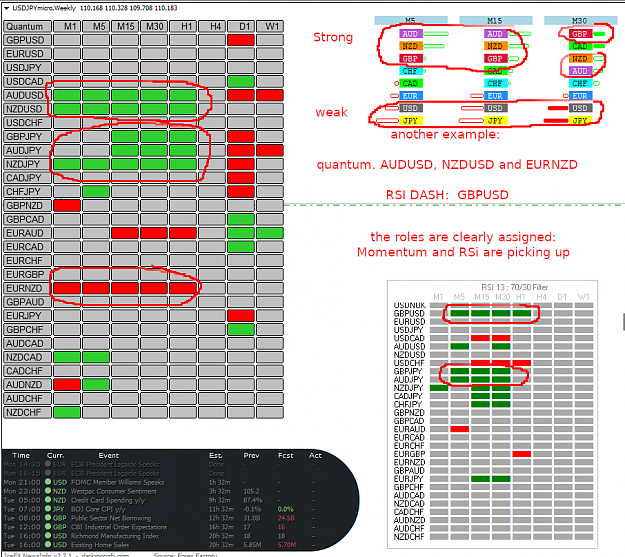
The second point is very important to find an entry point that makes sense. Point 2 shows me which currencies are currently strong and weak.
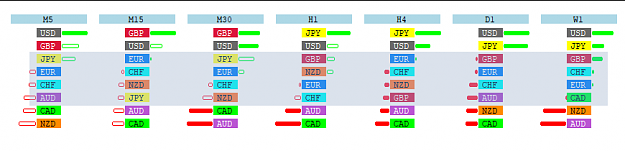
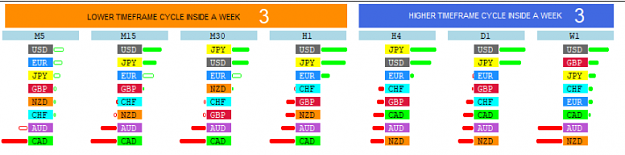
Point 3 gives me a good overview and can see there whether the course of a currency is confirmed on several time frames and when it falls or rises again.
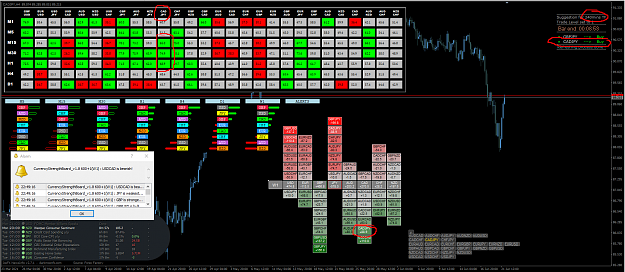
Point 5 and 6 then show me when it really starts.
Finally, I consider a true saying that goes like this:
The truth is somewhere in the middle:
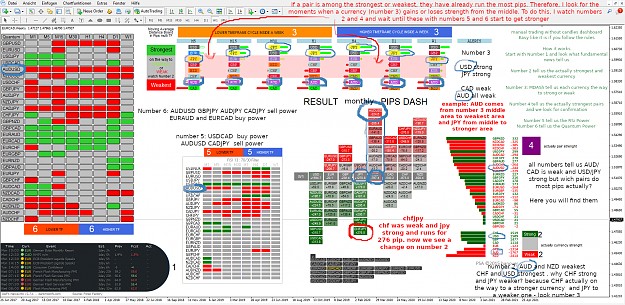
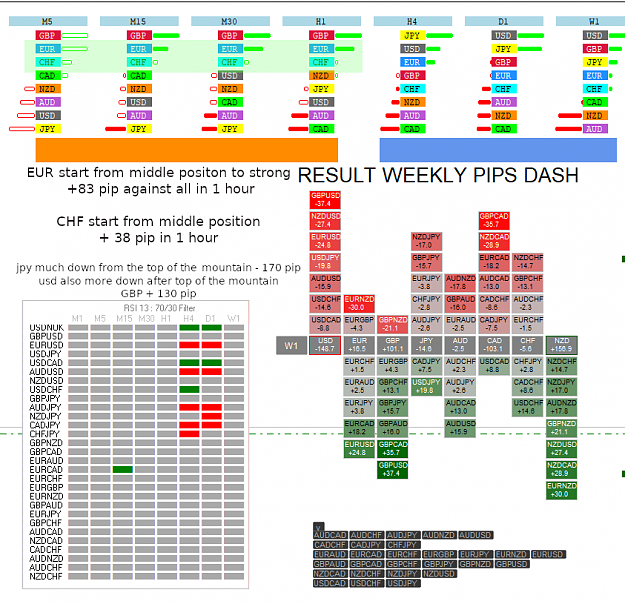
This is very important because I try to trade rising or falling currencies from the middle and not when they are already up or down. So always from the middle:
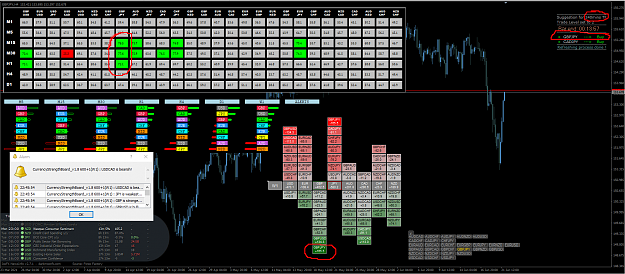
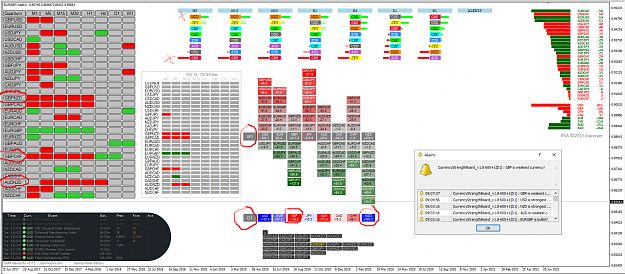
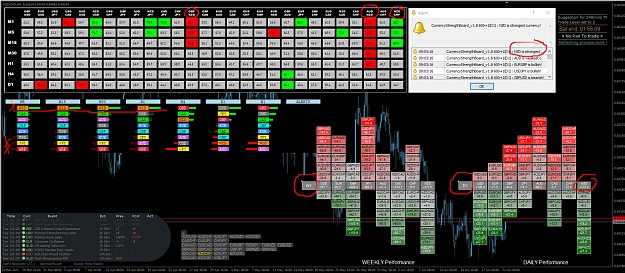
Now look at the two pictures. The first without explanation, the second with explanation. As an example I have chosen AUD and JPY because both once came from the middle.
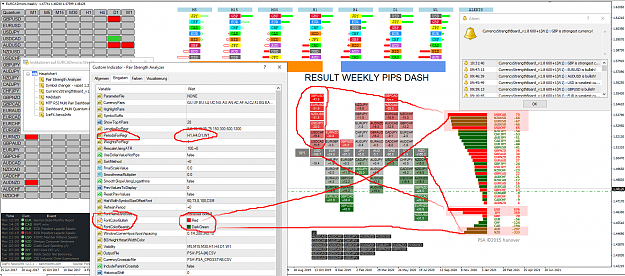
You can find the indicators here in the forum, but include them in the attachment as they are all available from the Netwicklers free of charge. ( ( Monthly Dash Template zip file ) Settings from the indicators are included. I also include my template, but I use a monitor with a resolution of 1920 x 1080 pixels. So you have to adjust the indicators correctly for smaller and larger resolutions or monitors.
Now, as a German, I am not so empowered to speak English and mostly use the translater, but I hope we can get along well.
Discussions very much appreciated.
Your Pagaleo
I was sick of watching candles and formations forever. I have been interested in dashboard trading for a long time and use some indicators that were developed by users from this great forum.
Do you know that? Someone who matters coughs or says something meaningful or not meaningful and courses respond immediately? How was it with Ronaldo when he said he should drink more water and not cola and the cola price lost about 1.8 billion dollars in value? A footballer? If something like that is already possible then I don't need any more candles strategy and formations. Or how was it with elon musk and the DOGE Coin, which is known and recognized as a pure fake? For example, he posts a dog that smiles and the coin shoots upwards. crazy shit how peoples in good positions with many followers make money from nothing.
We are trading in a crazy market and this "cough" as I call it is increasingly used to give currencies a certain nudge in the desired direction.
Every official and insider news, true or false, affects the markets.
But now I come to the idea and the template what I have put together from the indicators and ask whether some would like to discuss it.
I put it together according to a 6 point plan and try to learn from previous wrong approaches.
I post 2 pictures immediately after this opening post.
I am interested in recognizing fundamental news and the changes between the individual currencies. So not really new so far. Fundamental data are therefore always in the first place with me to see why some currencies are getting weaker and others are getting stronger.
The second point is very important to find an entry point that makes sense. Point 2 shows me which currencies are currently strong and weak.
Point 3 gives me a good overview and can see there whether the course of a currency is confirmed on several time frames and when it falls or rises again.
Point 5 and 6 then show me when it really starts.
Finally, I consider a true saying that goes like this:
The truth is somewhere in the middle:
This is very important because I try to trade rising or falling currencies from the middle and not when they are already up or down. So always from the middle:
Now look at the two pictures. The first without explanation, the second with explanation. As an example I have chosen AUD and JPY because both once came from the middle.
You can find the indicators here in the forum, but include them in the attachment as they are all available from the Netwicklers free of charge. ( ( Monthly Dash Template zip file ) Settings from the indicators are included. I also include my template, but I use a monitor with a resolution of 1920 x 1080 pixels. So you have to adjust the indicators correctly for smaller and larger resolutions or monitors.
Now, as a German, I am not so empowered to speak English and mostly use the translater, but I hope we can get along well.
Discussions very much appreciated.
Your Pagaleo
Attached File(s)