Attached Image (click to enlarge)
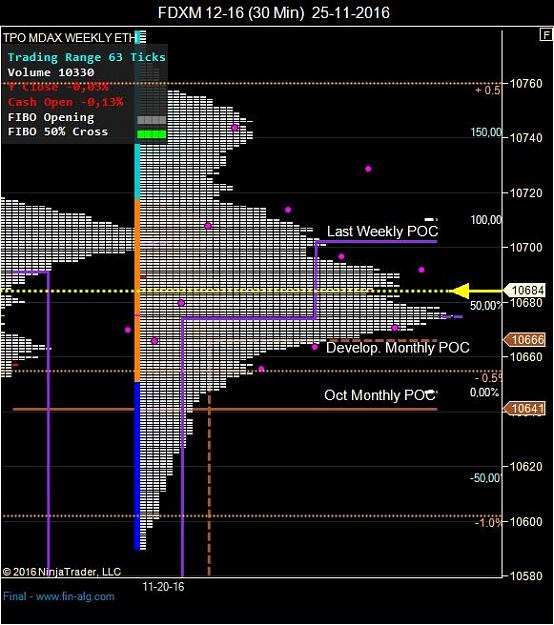
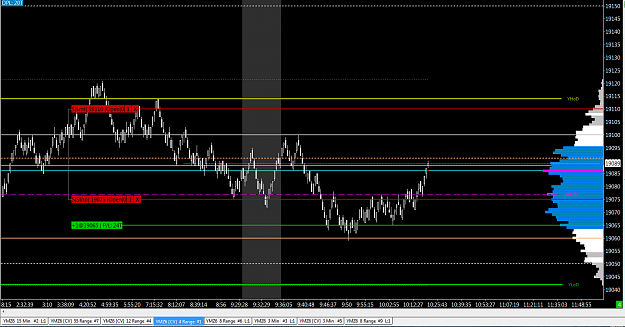
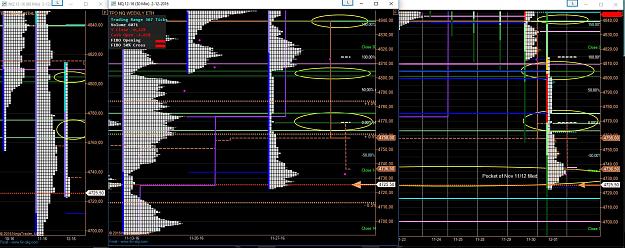
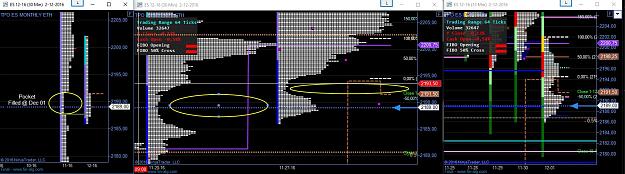
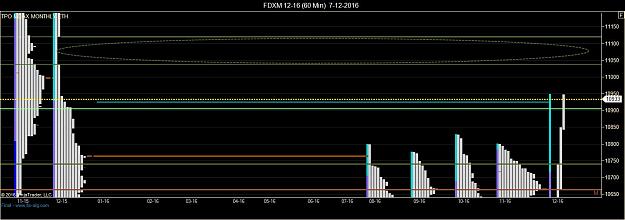
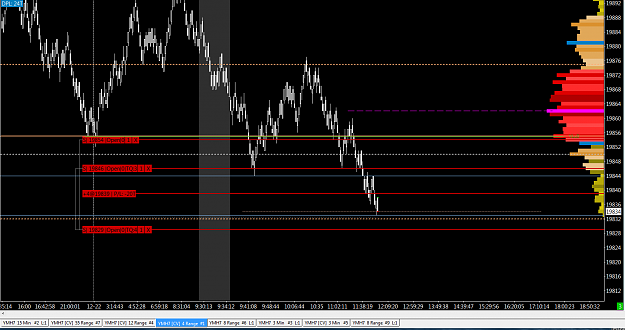
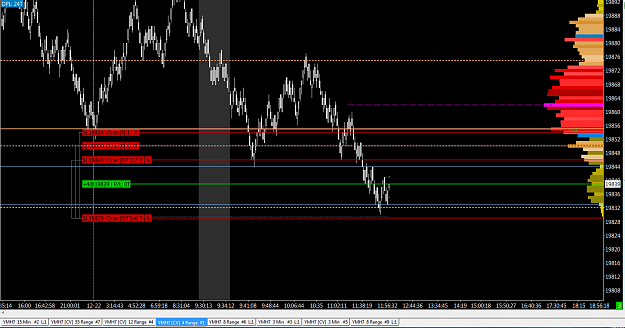
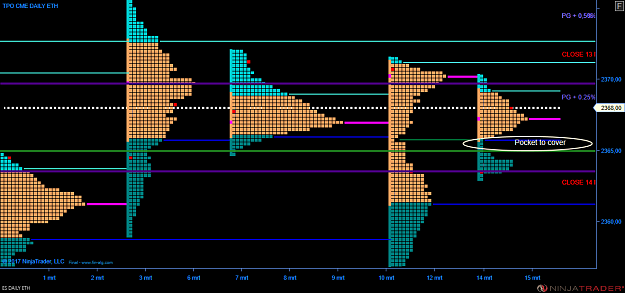
Market Profile charts show very clear wher heavy traded zone and light trade zone are to find.
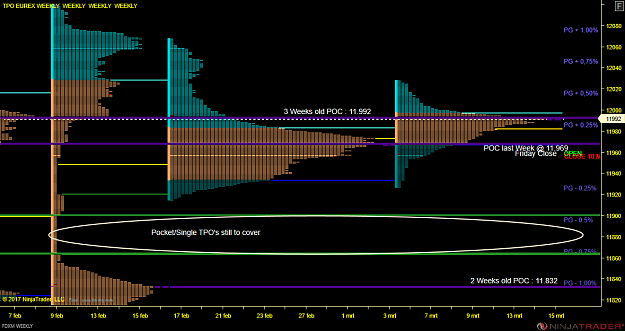
POC lines / single TPO block on fast /light traded zone are easy to detect.
Market Profile charts (TPO charts) can't predict as no one other chart what the direction of the market will become.
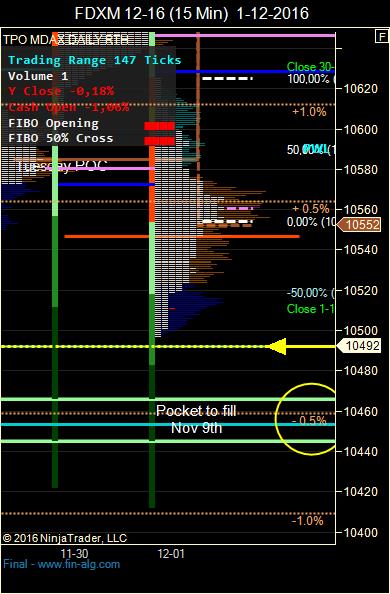
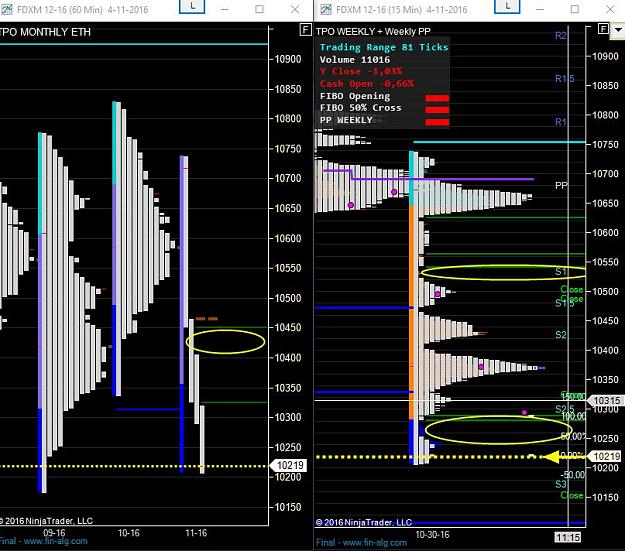
However it shows area's/zones where the market has to go back to fill up some light traded zone, so called pockets on the tPO chart where very few TPO blocks are plotted.
See the TPO charts as a road map where you can look for desitination and supp/res. zones.
"It's better to be out wishing to be in... than to be in wishing to be out!