Hello gang, it's been several years since I posted last and have come back to get in the swing of things again. I had been out with several severe personal health issues and also some family issues and have not been able to focus on my trading, among other things. I hope to go over some older threads and trying to answer questions, so please do not be offended or feel disrespected if I do not answer pm's or e-mails right away.
First things first, some of the things I've learned over the past decade and strategies posted on here are probably really outdated have have most likely run their course or have been modified so much you wouldn't even tell where it originally came from. So let's start with something simple and fresh.
We all know that it is very easy to overload a chart with the latest and greatest indicators making your chart look really pretty, but in essence worthless to trade on. I've learned to keep it very simple and let the fundamentals of price action and learning when the true trading begins. We see tons of London breakouts on the forums and this one is designed with a little twist. Instead of concentrating on the London open, we are setting up our trading scenario to exploit the flaw in the Frankfurt open. So here is the Quantum London Trading Strategy.
Set Up
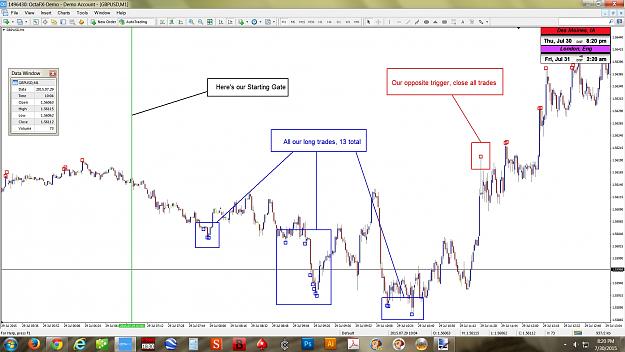
To set this up, download the indicator and template below. I am using OctaFX, but feel free to use whatever broker you desire. OctaFX is GMT+2, so make sure when we set this up your times are in sync. Open a 1 minute GBP/USD chart and load up the template. The template should have this saved on it but if not, place a vertical line on the chart at 5:00 am GMT (7:00 am on OctaFX).
As you can see, we have numerous little boxes on the chart covering all times of the day. But we are looking for one particular range of time here. As we know when the Tokyo opens and we see a little action there, then we going into a little ranging period most of the time after the new day starts at 00:00 GMT until the London open hits. But people forget the the Frankfurt open usually give us a little false sense of direction before the real trading direction is determined. The slowest volume of the day is normally between 4-6:00 am GMT. Here is our starting point right in the middle at 5:00 am. We will ignore any boxes formed before this time. Basically what we are seeing is an invisible ZigZag indicator in action but when a new hi/low is reached the old box stays on the chart instead of disappearing. This is what we will base our trades on.
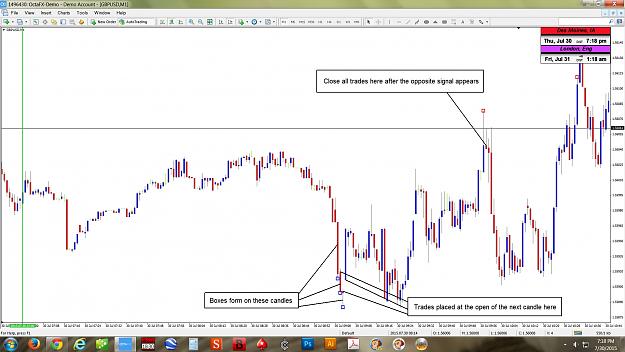
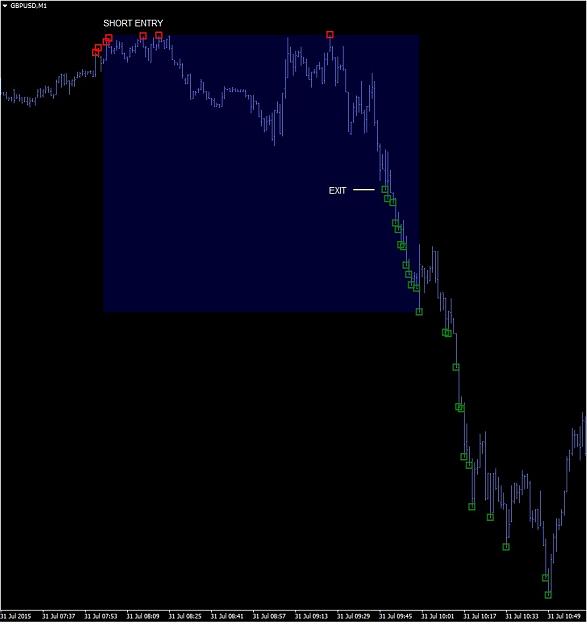
Rules for entry
This is the simple part. We open a new trade at the opening of the next candle after a box appears, Blue boxes for long trades and Red boxes are short trades. We continue to add trades at each box that appears until we encounter an opposite colored box in which all the trades are closed at once when the new candle opens. This is the tough part: RESTRAINT!!!!! Even though it may look like there are numerous opportunities to re-enter other runs, don't! This is where you can get caught in a super long run during the London session only to get caught in the ranging period later in the day. Trading size is also very crucial as you may have 1 or 2 trades going or basket of 40+ or more. Here's how you can enter your trades (and it may be totally different for someone else depending on their risk factor):
Trades 1-12=.01 Lots
Trades 13-21=.02 Lots
Trades 22-29=.05 Lots
Trades 30-36=.13 Lots
Trades 37-39=.34 Lots
Trade 40 =.89 Lots
I am only using 40 levels as an example for this strategy. You can spread it out with more levels with lower lots to begin with then ramp it up on the last 1/4 or so, whatever floats your boat. I have a basket calculation for 80 levels that I use. But in this example if we ever got up to 40 trades, we'd only have a total of 3.52 lots in play. But remember, we are going to be using restraint here and taking only the prime first trade of the session.
So now lets show what the setup looks like using today's chart in the next post. All results posted do not include any spreads, slippage, commissions, or any other factors affecting the total number of pips.
There is an EA in development in the thread below if anyone is interested.
Quantum EA
First things first, some of the things I've learned over the past decade and strategies posted on here are probably really outdated have have most likely run their course or have been modified so much you wouldn't even tell where it originally came from. So let's start with something simple and fresh.
We all know that it is very easy to overload a chart with the latest and greatest indicators making your chart look really pretty, but in essence worthless to trade on. I've learned to keep it very simple and let the fundamentals of price action and learning when the true trading begins. We see tons of London breakouts on the forums and this one is designed with a little twist. Instead of concentrating on the London open, we are setting up our trading scenario to exploit the flaw in the Frankfurt open. So here is the Quantum London Trading Strategy.
Set Up
To set this up, download the indicator and template below. I am using OctaFX, but feel free to use whatever broker you desire. OctaFX is GMT+2, so make sure when we set this up your times are in sync. Open a 1 minute GBP/USD chart and load up the template. The template should have this saved on it but if not, place a vertical line on the chart at 5:00 am GMT (7:00 am on OctaFX).
As you can see, we have numerous little boxes on the chart covering all times of the day. But we are looking for one particular range of time here. As we know when the Tokyo opens and we see a little action there, then we going into a little ranging period most of the time after the new day starts at 00:00 GMT until the London open hits. But people forget the the Frankfurt open usually give us a little false sense of direction before the real trading direction is determined. The slowest volume of the day is normally between 4-6:00 am GMT. Here is our starting point right in the middle at 5:00 am. We will ignore any boxes formed before this time. Basically what we are seeing is an invisible ZigZag indicator in action but when a new hi/low is reached the old box stays on the chart instead of disappearing. This is what we will base our trades on.
Rules for entry
This is the simple part. We open a new trade at the opening of the next candle after a box appears, Blue boxes for long trades and Red boxes are short trades. We continue to add trades at each box that appears until we encounter an opposite colored box in which all the trades are closed at once when the new candle opens. This is the tough part: RESTRAINT!!!!! Even though it may look like there are numerous opportunities to re-enter other runs, don't! This is where you can get caught in a super long run during the London session only to get caught in the ranging period later in the day. Trading size is also very crucial as you may have 1 or 2 trades going or basket of 40+ or more. Here's how you can enter your trades (and it may be totally different for someone else depending on their risk factor):
Trades 1-12=.01 Lots
Trades 13-21=.02 Lots
Trades 22-29=.05 Lots
Trades 30-36=.13 Lots
Trades 37-39=.34 Lots
Trade 40 =.89 Lots
I am only using 40 levels as an example for this strategy. You can spread it out with more levels with lower lots to begin with then ramp it up on the last 1/4 or so, whatever floats your boat. I have a basket calculation for 80 levels that I use. But in this example if we ever got up to 40 trades, we'd only have a total of 3.52 lots in play. But remember, we are going to be using restraint here and taking only the prime first trade of the session.
So now lets show what the setup looks like using today's chart in the next post. All results posted do not include any spreads, slippage, commissions, or any other factors affecting the total number of pips.
There is an EA in development in the thread below if anyone is interested.
Quantum EA
Attached File(s)