- Search Energy EXCH
- 30 Results
-
 zortan replied Jan 19, 2018
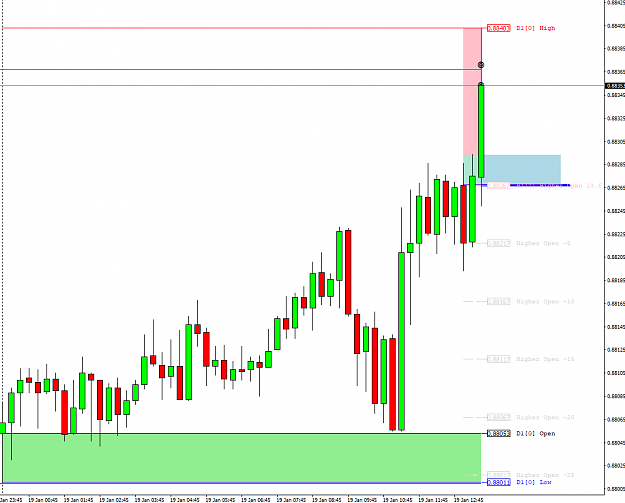
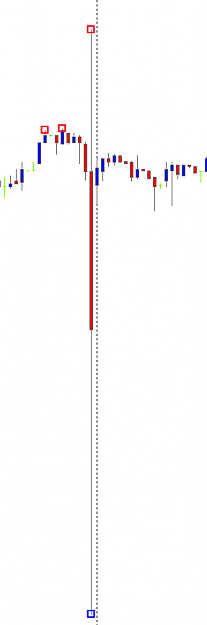
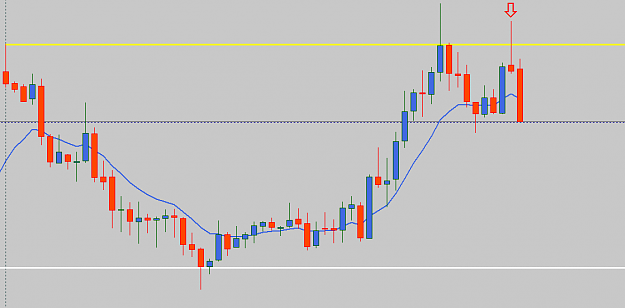
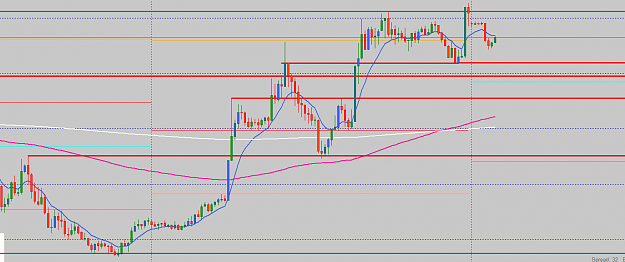
EG 15 minute, trade on present bar, didn't stand a chance if you took it Question - if you have several ranging bars like there is here do you still take trades? any personal preferences? image
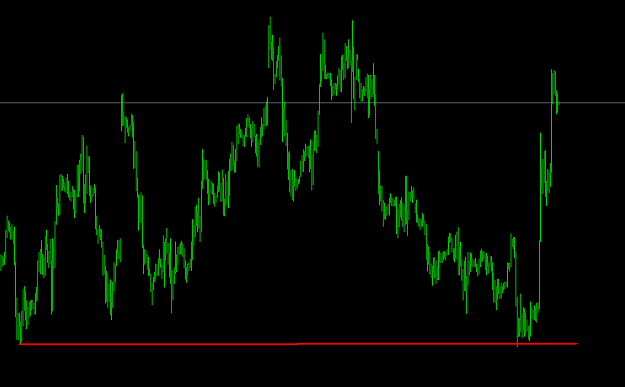
Highest Open / Lowest Open Trade
- zortan replied Jan 19, 2018
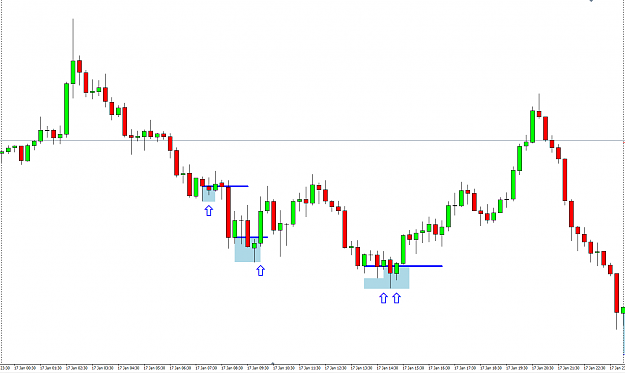
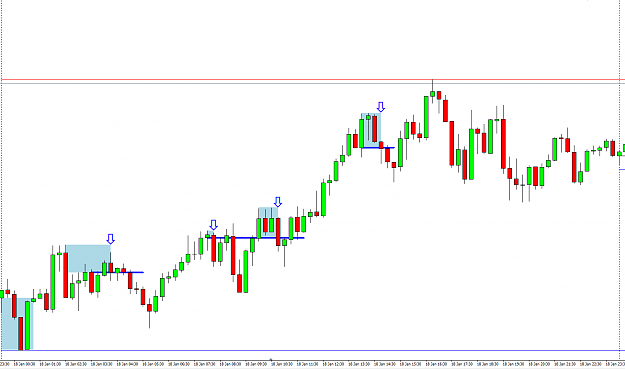
17th Jan - EU 15 minute - entry candles with arrows, thick blue line are entry points image 18th Jan - EU 15 minute image
Highest Open / Lowest Open Trade
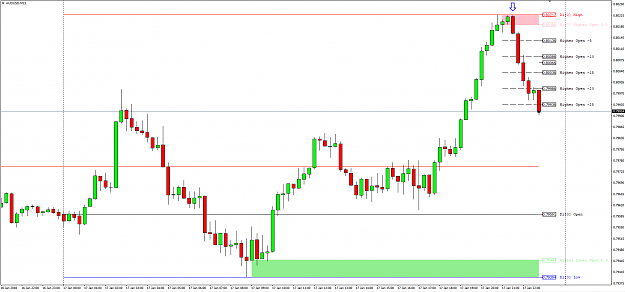
- zortan replied Jan 17, 2018
If you're not scared of breakout territory audusd would have been very nice. image
Highest Open / Lowest Open Trade
- zortan replied Jan 14, 2018
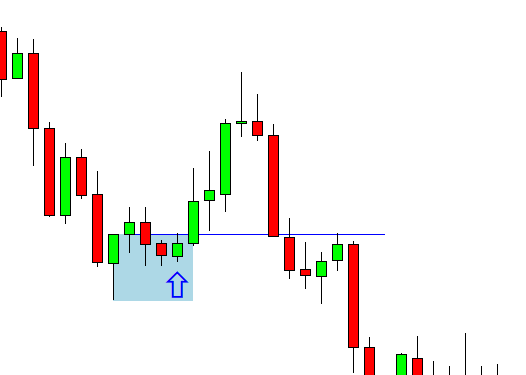
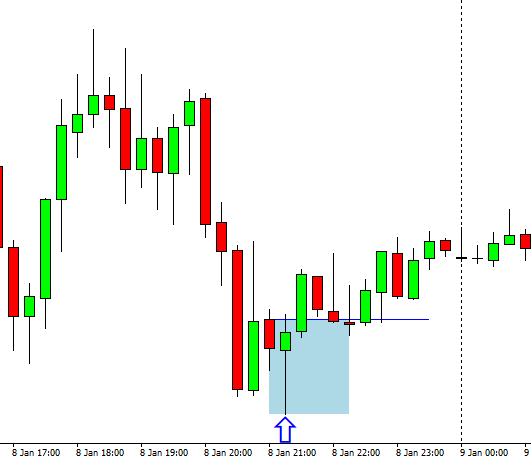
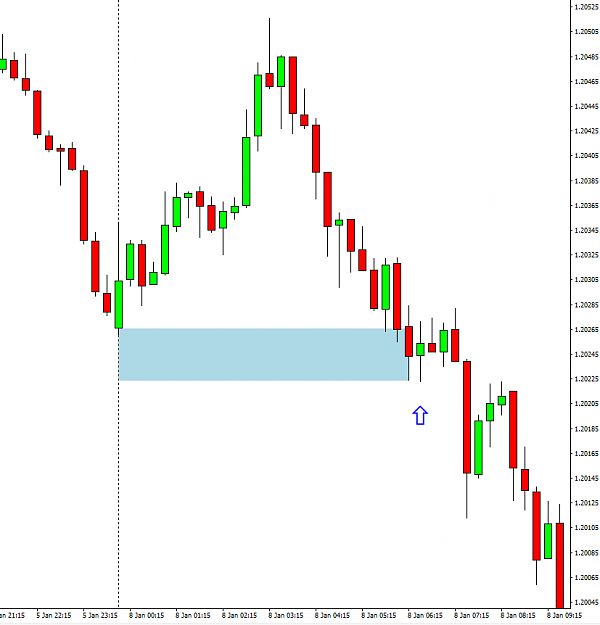
Here are the 3 trades from the 8th (all 15 minute charts) 0630 candle image 1145 candle (the 1 hour candle makes a new lowest open, drops a little, then goes up past the open again, would that be a trade?) image 2115 (In my original post I put ...
Highest Open / Lowest Open Trade
- zortan replied Aug 24, 2015
I wonder how the EA will cope with this, July 11th 2014 image
Quantum London Trading
- zortan replied Oct 15, 2012
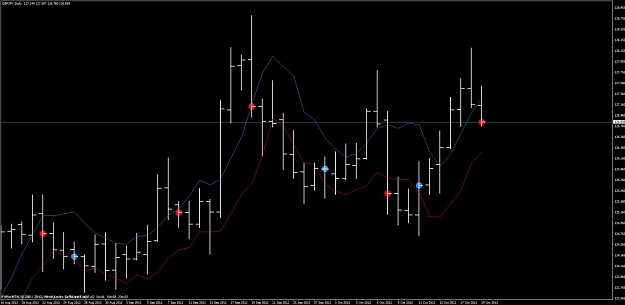
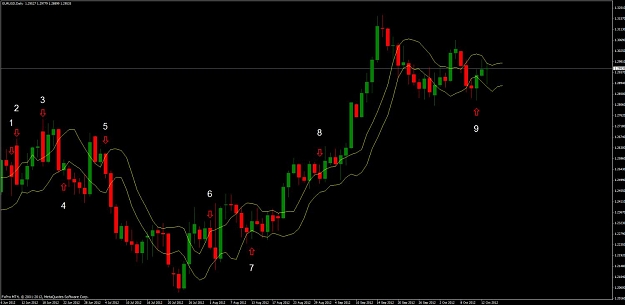
I see 9 trades on EU since June, how would you have traded them? are there any more I've missed? would you have taken all of them? image
The7 Trading System
- zortan replied Oct 10, 2012
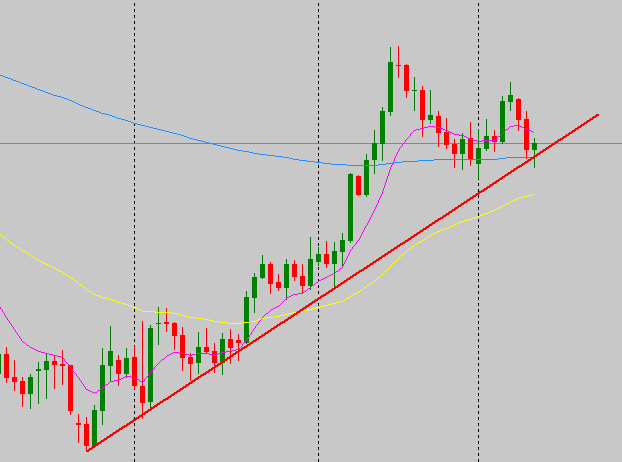
Did you look at the daily chart? image
Another simple system - Time-Frame 15
- zortan replied Jul 5, 2012
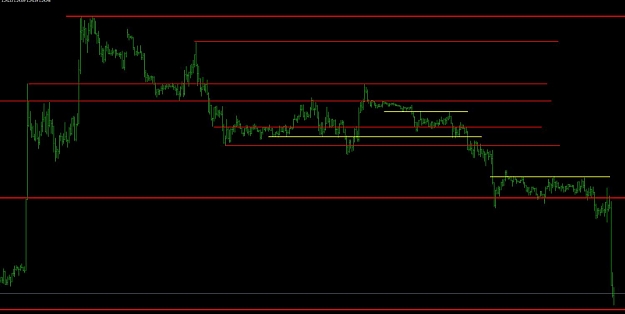
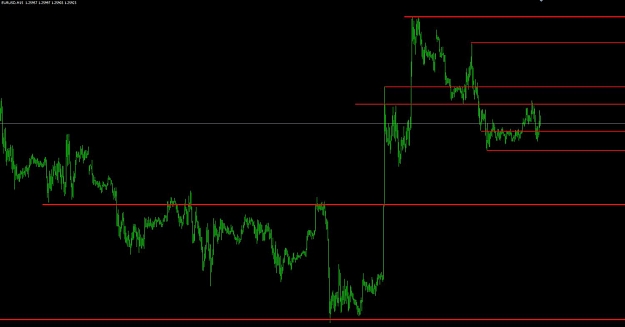
Just support and resistance — The bare chart I posted on Tuesday image Look at the price reactions to the S & R lines since, yellow lines are new levels as they appear. image
Another simple system - Time-Frame 15

- zortan replied Jul 4, 2012
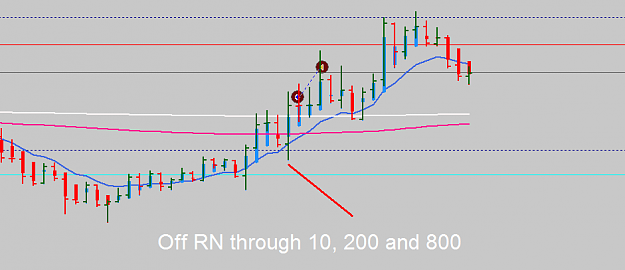
GU — GU 15 min trade, off of 800, through S2 and s & r line. Most importantly there's nothing in it's way, look to the left no candles, all the MA's, RN and S & R are 'behind' the trade. As those on the skype room keep hearing from me, get ...
Another simple system - Time-Frame 15
- zortan replied Jul 3, 2012
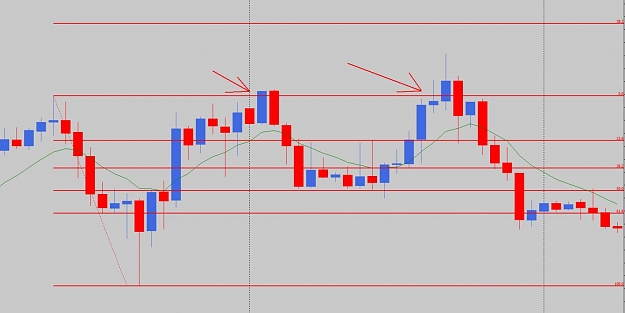
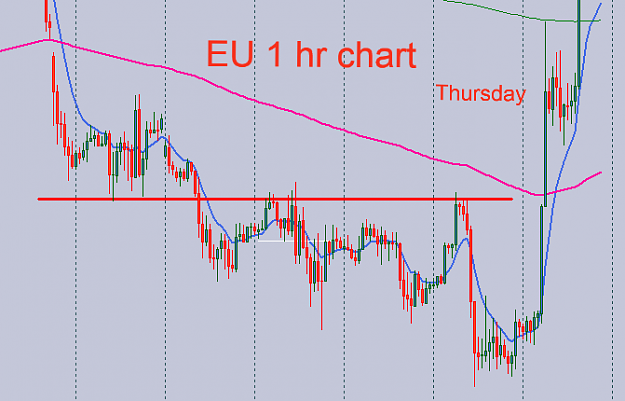
Here is a 1 hr chart for to make it easier to see, which arrow would the entry be?? image
Quicker and Dirtier EOD
- zortan replied Jul 3, 2012
Eni, apart from pivot points the only way is with your eyes. Practice on clean charts with no indicators and no grid Plenty on here I haven't added image
Another simple system - Time-Frame 15
- zortan replied Jul 2, 2012
AU 15 min chart, another pin bar in the 'right' place. image
Another simple system - Time-Frame 15
- zortan replied Jul 2, 2012
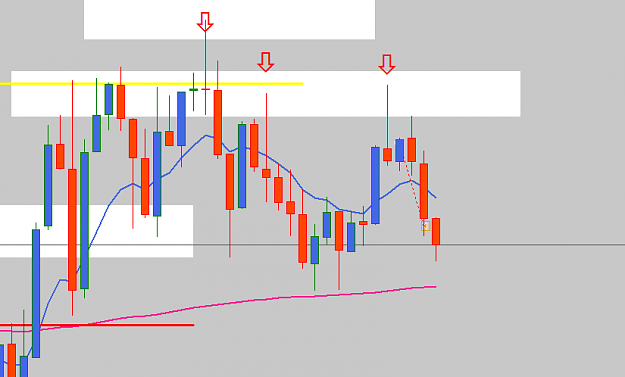
From the S & R areas on the GU 15 min, there were THREE quick trades of pin bars available on the 5 min chart, ALL low risk, the 1st and 3rd were the best. I took the 3rd and that's it for the day. image
Another simple system - Time-Frame 15
- zortan replied Jul 2, 2012
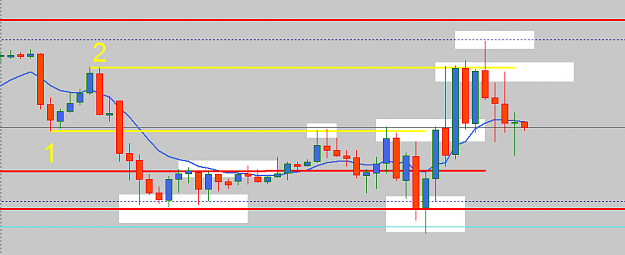
Follow up to post #3300, GU 15 min chart image 1 and 2 show where NEW areas of S & R are created, always keep an eye to the left of price to see where highs and lows can start to act as support or resistance. The white areas show where price has ...
Another simple system - Time-Frame 15
- zortan replied Jul 1, 2012
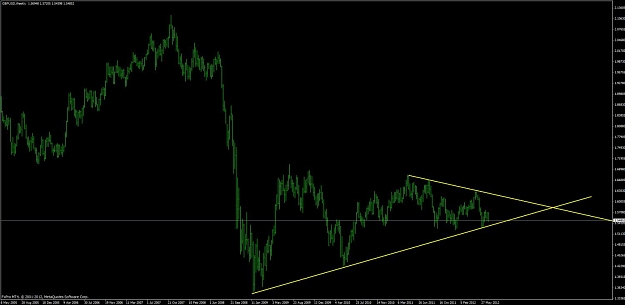
GU 15 min — GU 15 min chart with S & R lines in red, daily pivots, 200 & 800 MA's and round numbers. Looking for price action at these points, also looking to have these 'behind' any trade for a SL (the more the better). image
Another simple system - Time-Frame 15
- zortan replied Jun 30, 2012
The problem with a touch of the 10 on the daily is the actual touch doesn't happen until price has already dropped well below it, at the time of the 200 cross on the 15 min chart the daily probably wasn't a touch, as price shot through then it ...
Another simple system - Time-Frame 15
- zortan replied Jun 13, 2012
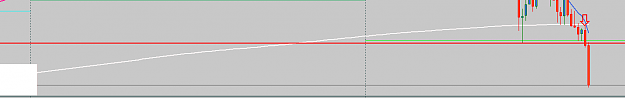
This is where I took my trade on it this morning, I didn't need tdi confirmation. image
Another simple system - Time-Frame 15