- Search Energy EXCH
- 941 Results (4 Threads , 937 Replies )
-
 yousername replied Dec 13, 2022
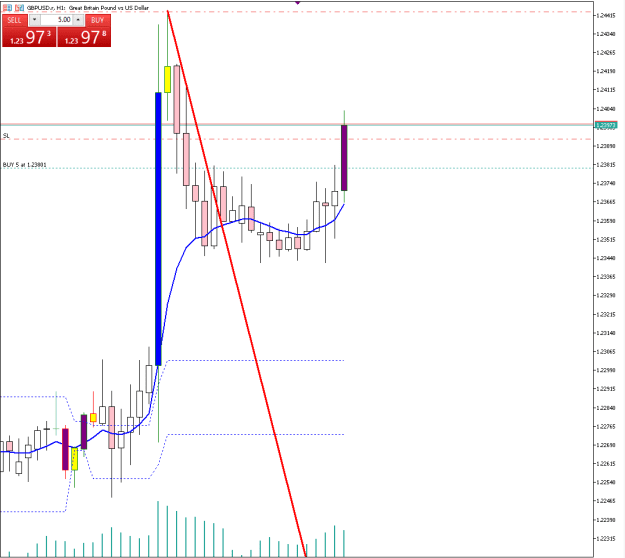
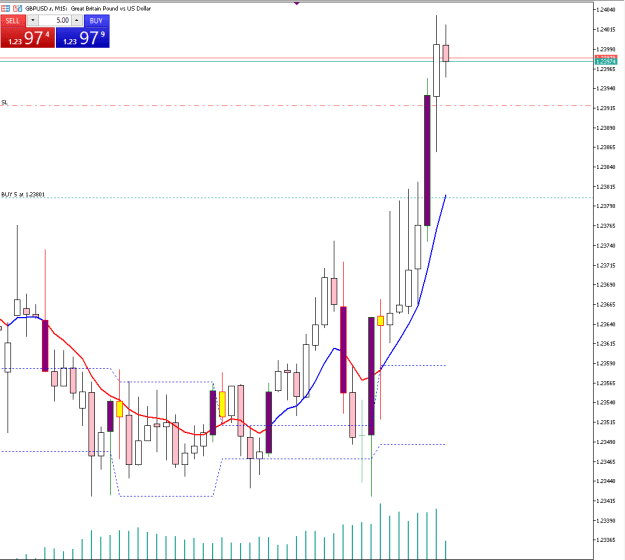
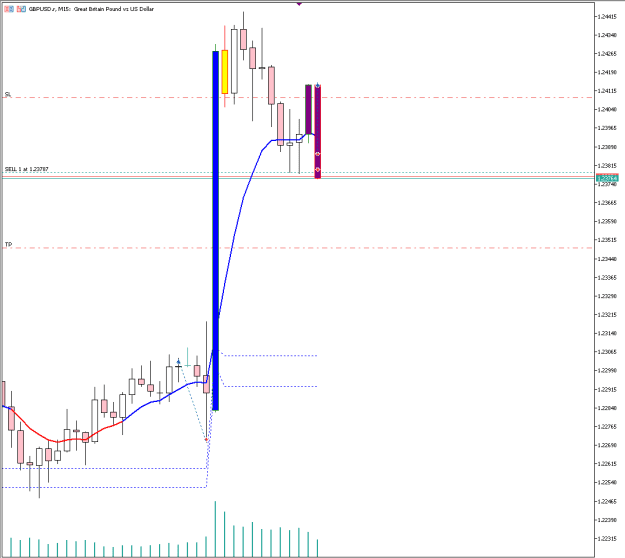
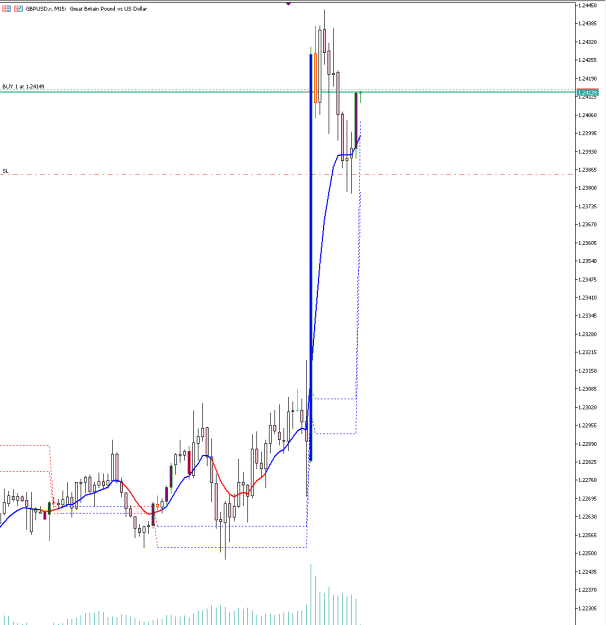
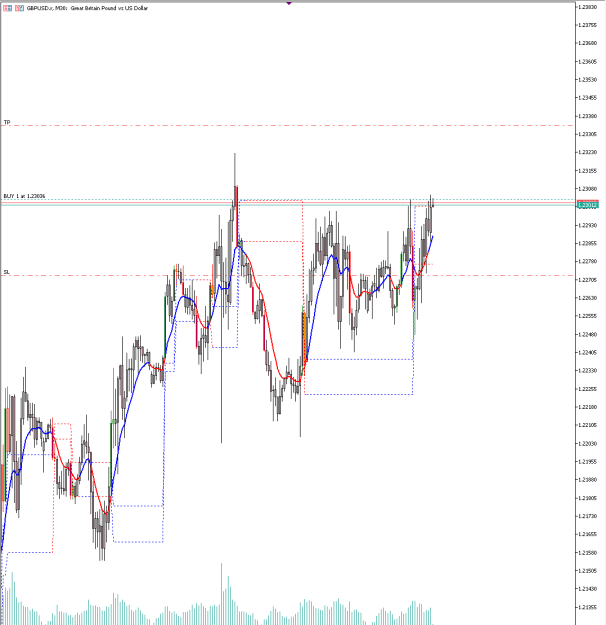
Long pound GBPUSD with 1:1 RR SL 30 pips image
Cable Update (GBPUSD)
- yousername replied Sep 1, 2020
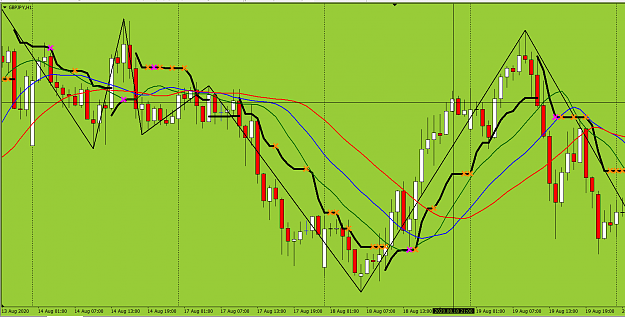
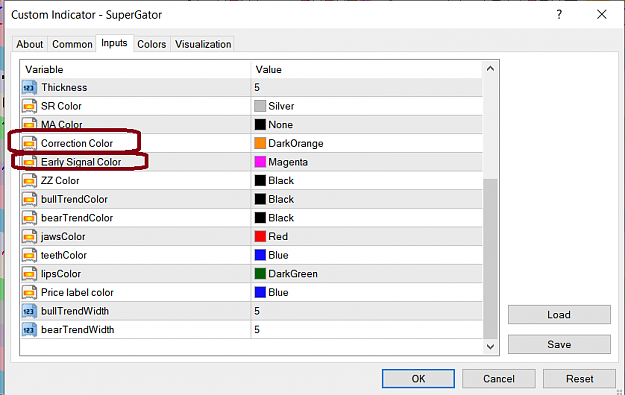
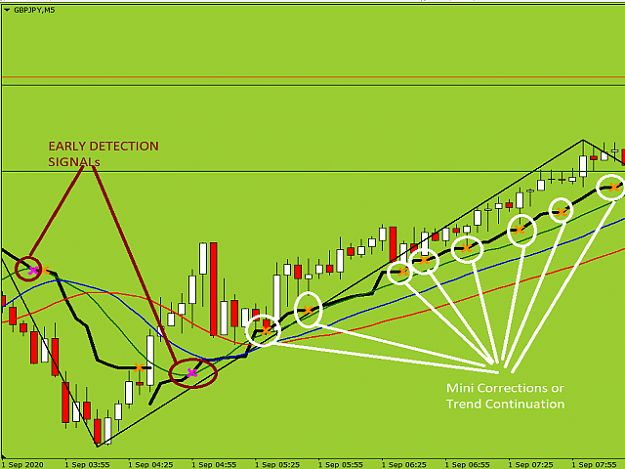
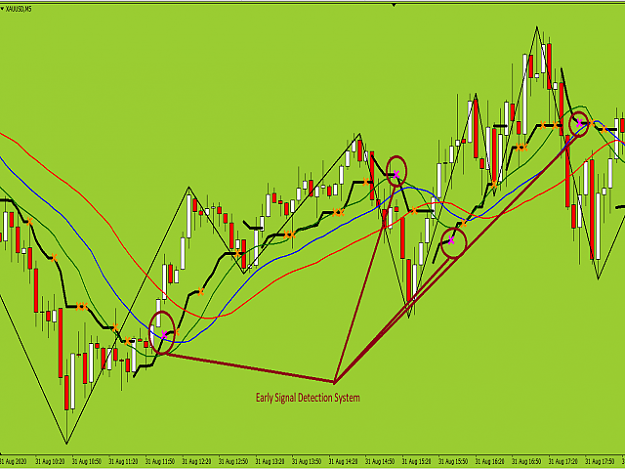
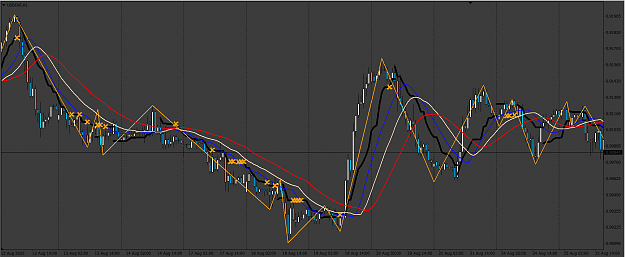
Early buy/sell signal detection system. Download See early detection signal in Purple/Magenta color And correction/trend continuation in orange color image image image inputs image Template file provided
Super Lunatic Gator System
- yousername replied Aug 31, 2020
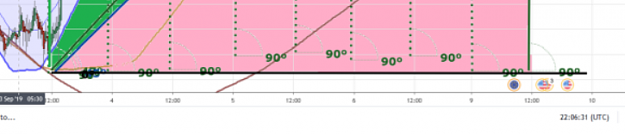
Ohh ok cool, So you just draw 90 degree angle right next to the previous 90 degree angle? image
W.D. Gann planetary price & timing analysis
- yousername replied Aug 29, 2020
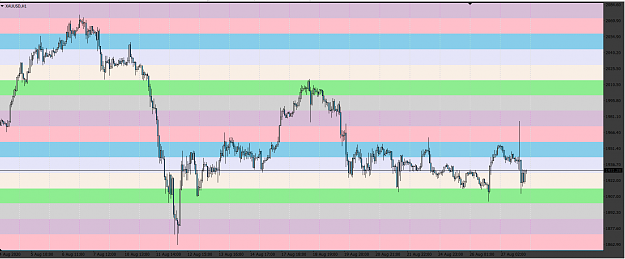
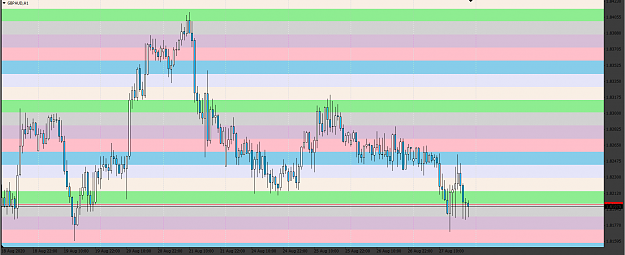
Additional Information on 144 Indicator How to identify a ranging market with 144? A: If the market is ranging between 2 to 6 zones, and there are at least 6 or 7 candles you can conclude that it's a ranging market. This is where you look for ...
Super Lunatic Gator System
- yousername replied Aug 28, 2020
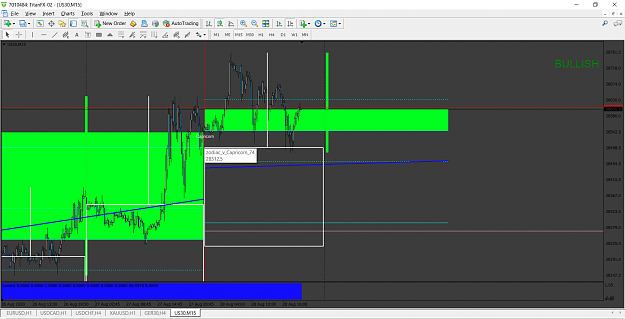
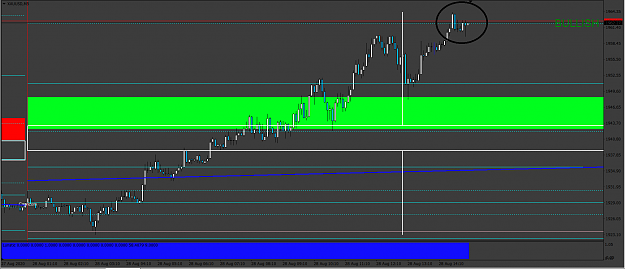
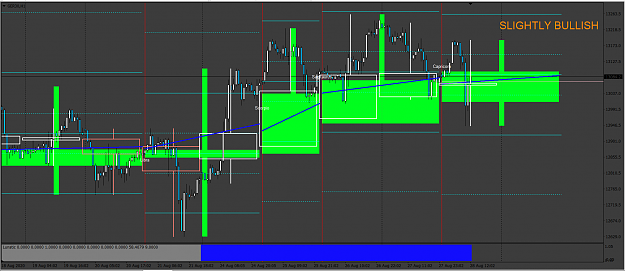
image X is shown in M5 TF. It means we could take profit or buy again or do counter trading. It's up to you as the trader. But for me now, I rather let the trade go up or hit my 10 pips positive SL. I'm happy for now
Super Lunatic Gator System
- yousername replied Aug 28, 2020
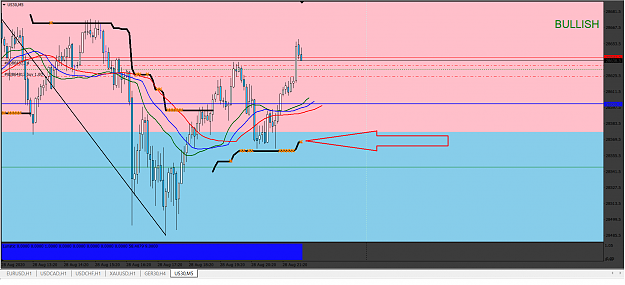
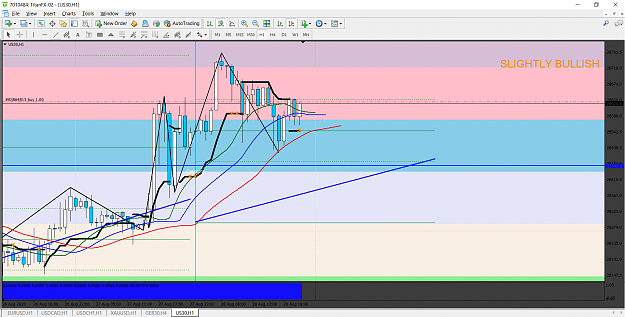
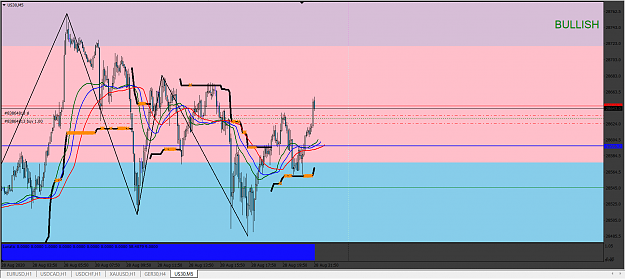
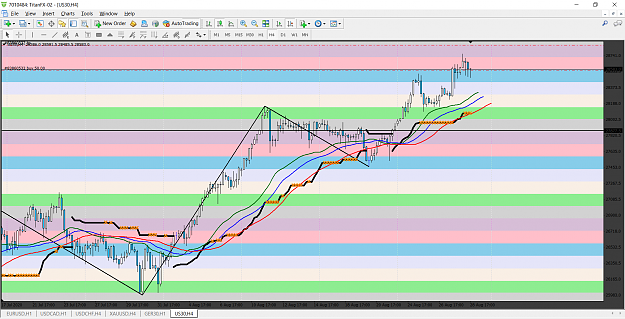
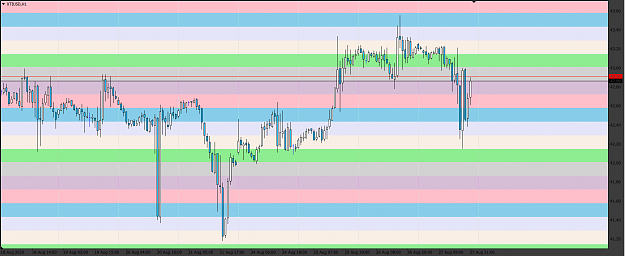
For US30, trade is closed, because the market isn't that volatile. It shy to break above the GANN's level. Will continue buying if it breaks above that level image US30 Buy again (1 lot) near the GANN's Level (Green dotted line) image SL modified ...
Super Lunatic Gator System
- yousername replied Aug 28, 2020
Buying spree continues.... BIRTHDAY PRESENT for my self image image
Super Lunatic Gator System
- yousername replied Aug 28, 2020
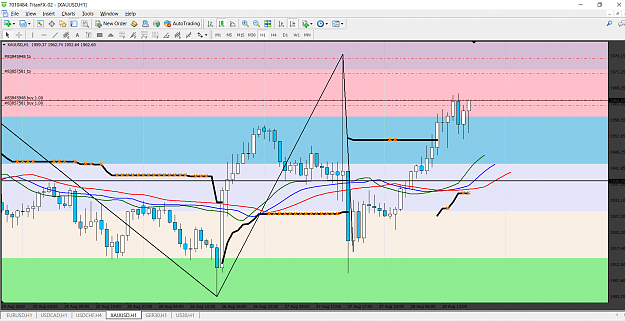
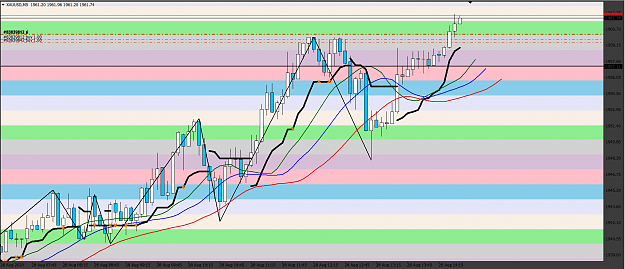
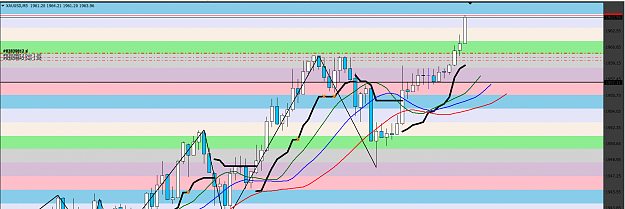
XAUUSD trades have been closed image Because I notice we are right at one of the GANNs S/R level.
Super Lunatic Gator System

- yousername replied Aug 28, 2020
Lunatic template. file Also please make sure the indi you have is the latest version image You can see where the version located right under the indi's icon in the mql5 page as seen in the screenshot image
Super Lunatic Gator System

- yousername replied Aug 28, 2020
image Hmm it looks fine on my end. Could you please give me your broker name so I can replicate your issue? I think the issue is with scalling. My broker DAX is 1 decimal, where yours is 2 decimals. Thanks!
Super Lunatic Gator System
- yousername replied Aug 28, 2020
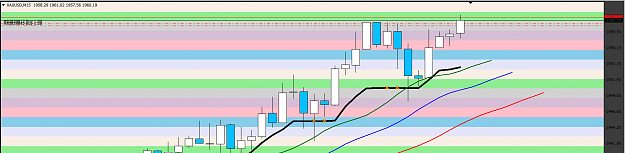
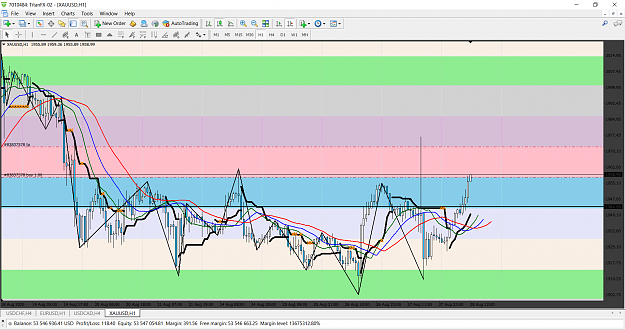
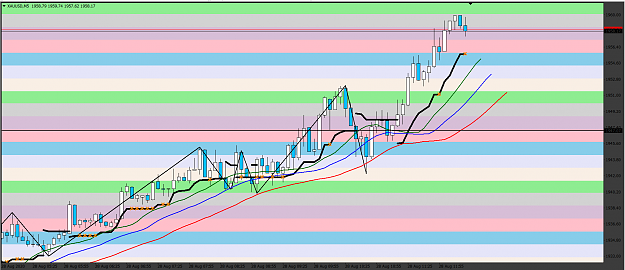
image XAUUSD long Target RED Zone or 1 octave above blue (the next blue zone) Update: Have decided to abort the long plan image Looking for another entry in M5 image 144 template file included file
Super Lunatic Gator System

- yousername replied Aug 27, 2020
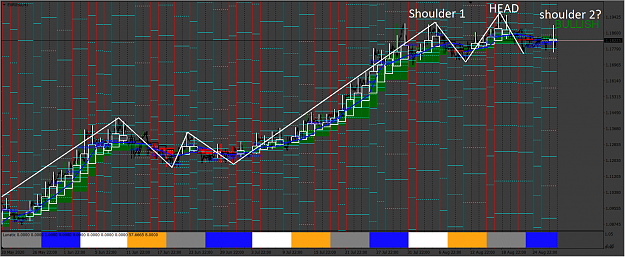
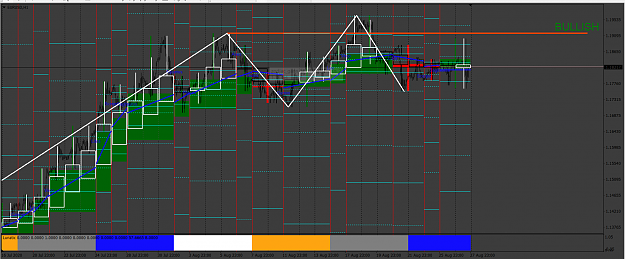
image Potential head and shoulder? Could be a fail H&S if it breaks above the orange line. image
EURUSD
- yousername replied Aug 27, 2020
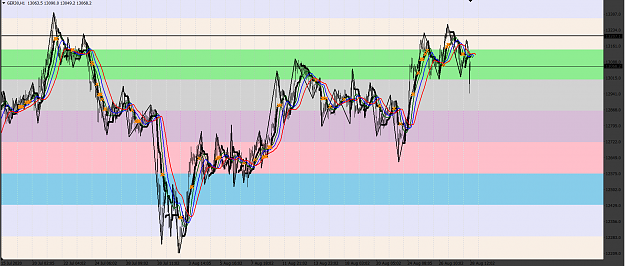
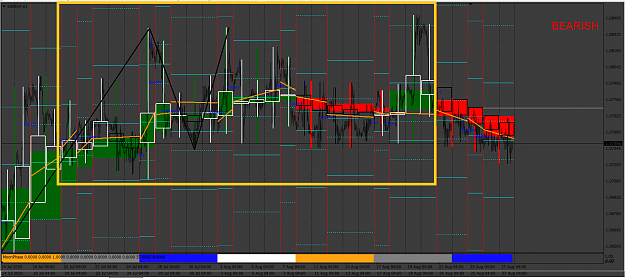
image Xs are printed along the super trend. In the screenshot, Xs are in yellow along the black super trend lines. You don't need to take all the Xs that appear in a row. When X appears, it is a mini back pull back of a strong trend which means ...
Super Lunatic Gator System
- yousername replied Aug 27, 2020
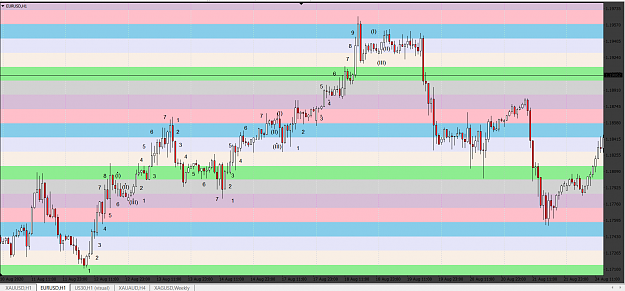
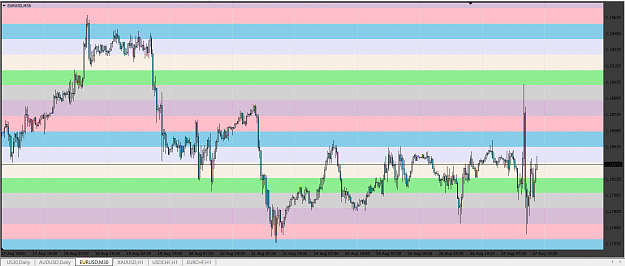
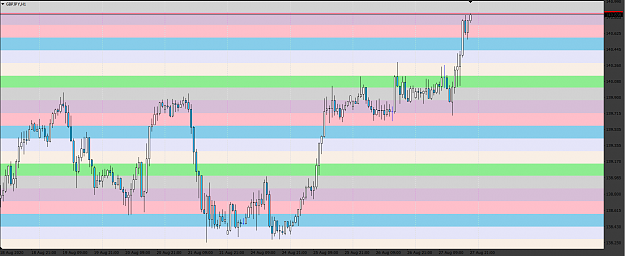
One Four Four Download This simple indicator displays support and resistance at fixed levels. The level won't change regardless how many days or minutes has gone by. There are 7 levels start from green ends at gray color. Imagine it like do ...
Super Lunatic Gator System
- yousername replied Aug 27, 2020
image EURCHF example of when not to place a trade series of heikenashi candlestick with wicks top and bottom and inside bars for days then follow with a bearish heikenashi candle that doesn't have wicks at the top and bottom (only single wick at ...
Super Lunatic Gator System
- yousername replied Aug 27, 2020
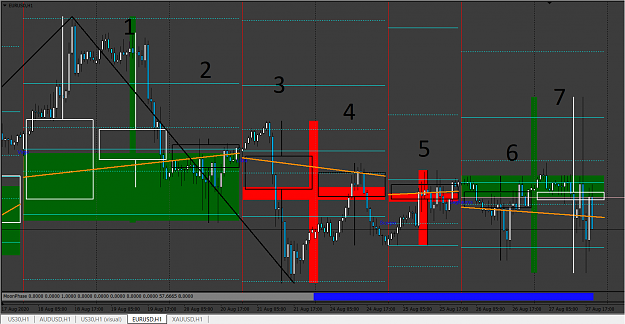
image EURUSD series of daily heikenashi candlestick (Black bearish, white bullish) 1 to 7 candles with inside bar and with wicks (top and bottom). This indicates sideway or market taking a break before continue it's trend or trend reversal. So ...
Super Lunatic Gator System