- Search Energy EXCH
- 65 Results (7 Threads , 58 Replies )
- Monte Carlo Simulation on Portfolio of Multiple StrategiesStarted Mar 16, 2024|Platform Tech|2 replies

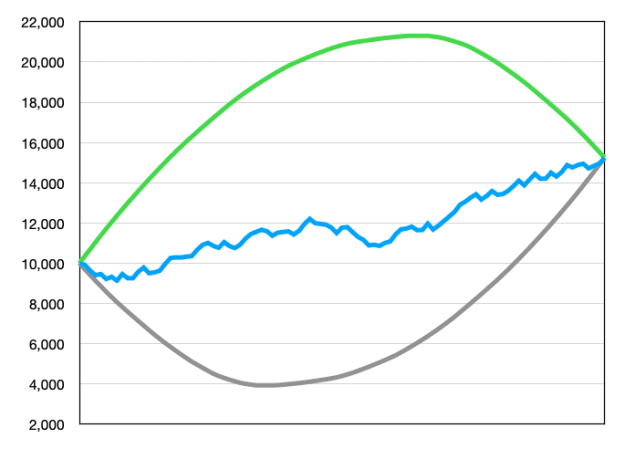
Single Strategy Monte Carlo When testing a strategy, the absolute profit of a strategy does not say ...
-
 yoriz replied Jan 24, 2024
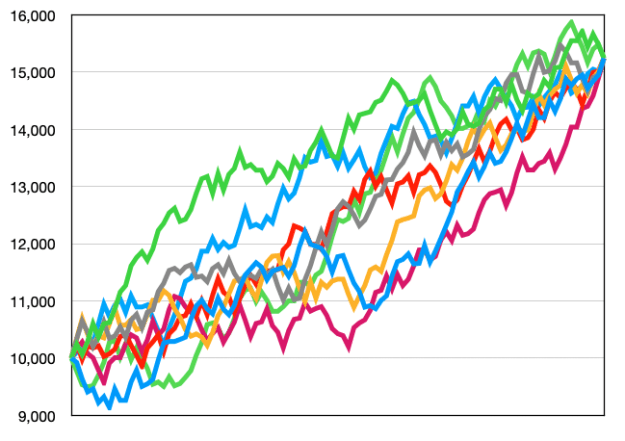
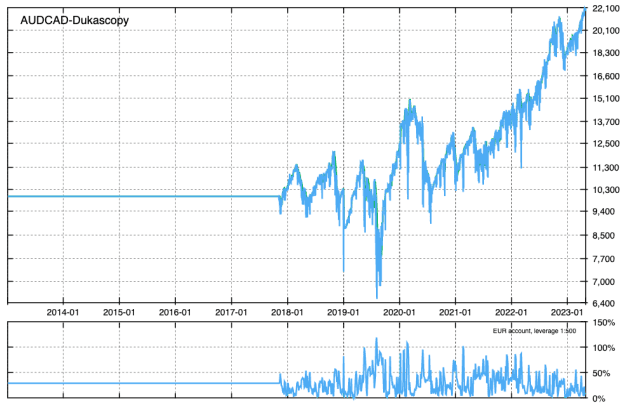
Below is a walk forward experiment on AUDCAD that creates and runs 5000 strategies in parallel where each of these strategies had their input parameters chosen randomly from these ranges: EntryHour = 1 .. 23 RandomSeed = 0 L1_TakeProfitPoints = 50 ...
The Myth of Averaging
- yoriz replied Jan 13, 2024
Not sure what your plan is with this strategy. You will need additional logic for the cases the price does not reach your profit target and you end up in deep drawdown. If you are "lucky" and chose a tiny profit target like $1 you can sometimes ...
Basic EA that buys and sells every candle
- yoriz replied Jan 10, 2024
Well, I indeed stumbled on your interesting thread :-) In my thread "The Myth of Averaging" I experimented with random entries and controlled exits. You can indeed achieve a positive expectancy using Averaging Down (adding to losing positions): ...
Random entries - Let's take it to the extreme
- yoriz replied Oct 5, 2023
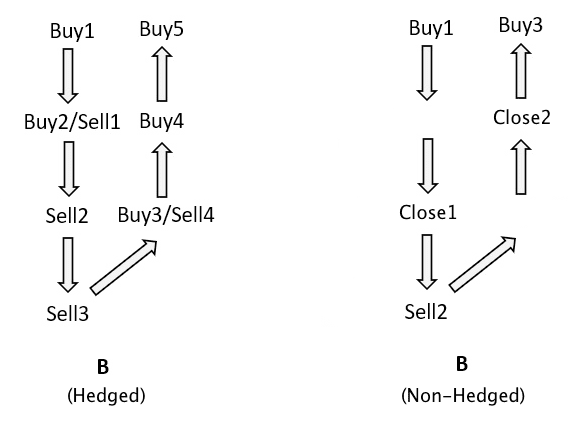
I wonder why many use hedging. You can always achieve the same effect by first closing positions and only opening trades in 1 direction, right? That way you save on commission and spread, and save margin/deposit load. For example Dave's example ...
Grid-Hedge Reboot #3
- yoriz replied Sep 10, 2023
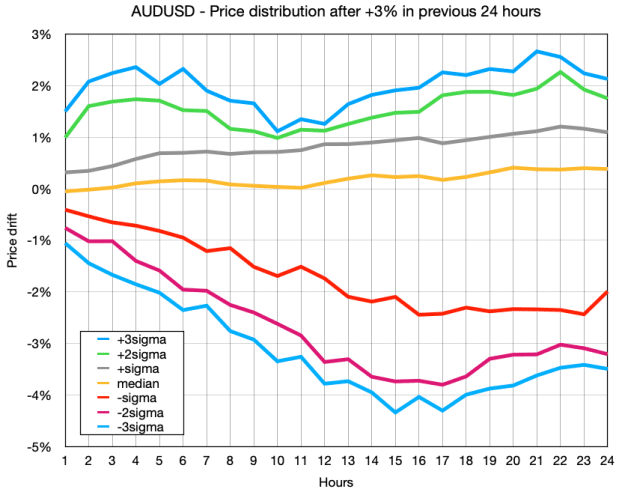
To test that hypothesis, I changed the script from post #169 to only measure the price drift at each M1 bar if price has changed at least +3% in the previous 24 hours. If skew is not real, you would think averaging over the last 4 years (=1.4M bars) ...
A Simple Mean Reversion Strategy
- yoriz replied Aug 31, 2023
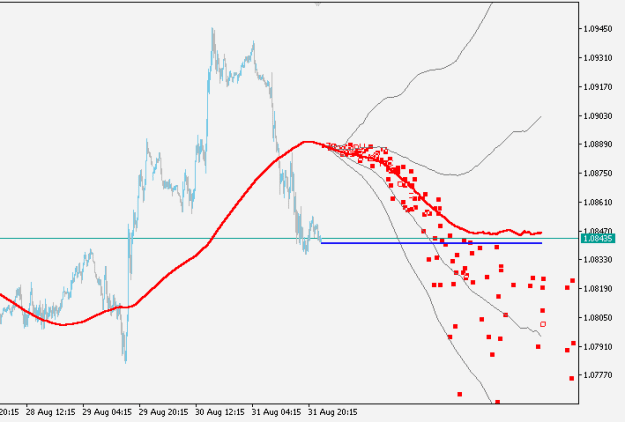
I have created a new toy for you guys! The indicator attached to this post is for MT5 and looks like this: image It mainly does three things: It predicts how the SMA200 will develop in the future (red and gray lines, median, +/- 1 sigma, +/- 2 ...
A Simple Mean Reversion Strategy
- yoriz replied Aug 25, 2023
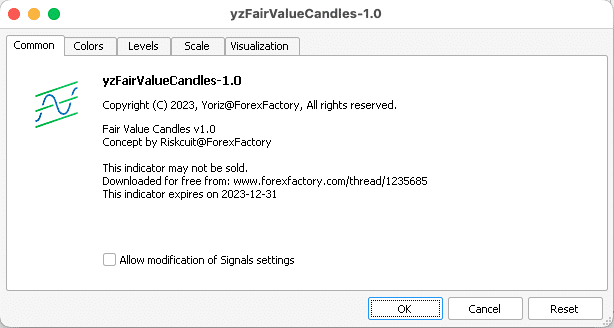
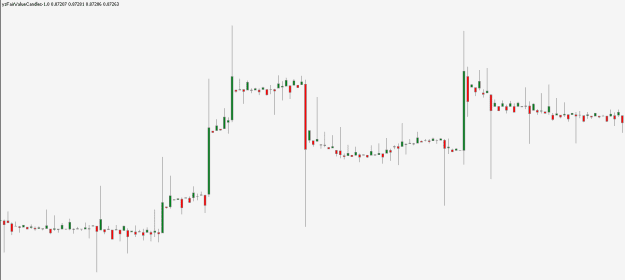
Here is an implementation of the Fair Value Candles indicator for MT5*: image file Here is an example screenshot: image *) No, I am not going to port the indicator to MT4. It is 2023. About time you upgrade to MT5... ;-)
A Simple Mean Reversion Strategy
- yoriz replied Aug 24, 2023
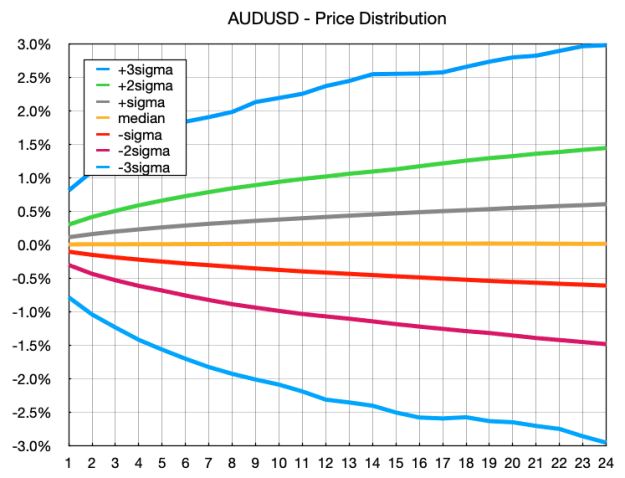
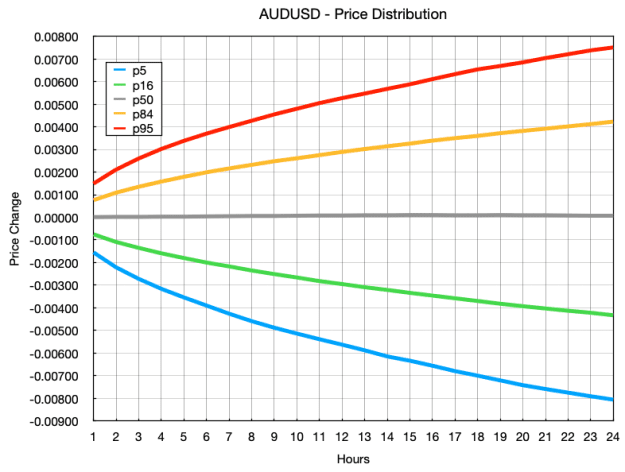
Excellent point! Indeed, I generated the stats based on the last 4 years which is a long time. Below is the corrected version using percentage return starting at each M1 bar of the last 4 years going forward up to 24 hours. Note that I added the 3 ...
A Simple Mean Reversion Strategy
- yoriz replied Aug 22, 2023
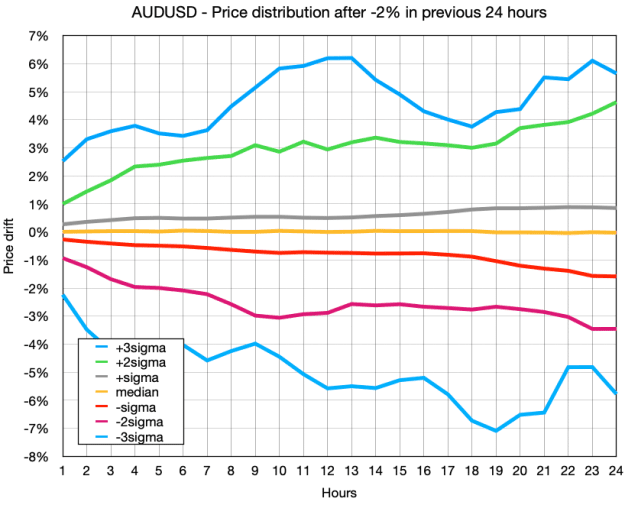
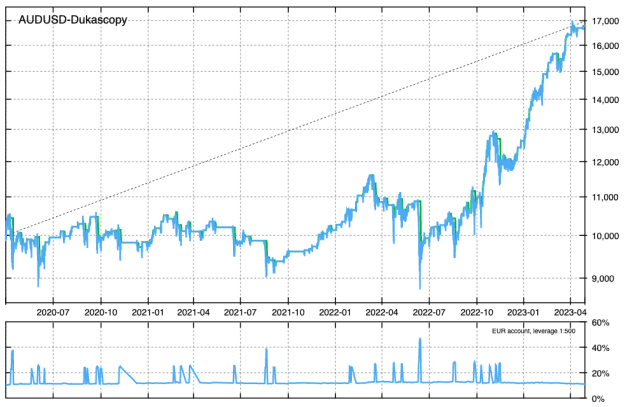
Another way to look at it, is to consider each M1 bar in the last years and measure how far price has drifted away after 1 hour, 2 hours, etc. Here are the stats for AUDUSD over the last 4 years showing the 1 sigma range (p16-p84) and the 2 sigma ...
A Simple Mean Reversion Strategy
- yoriz replied Aug 21, 2023
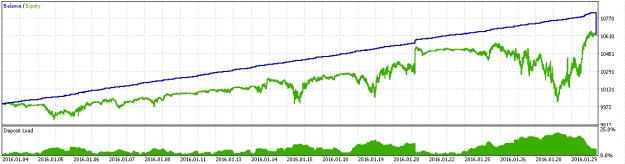
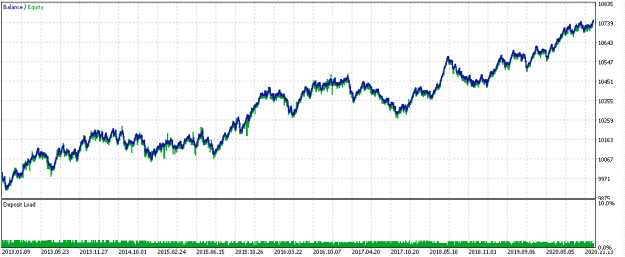
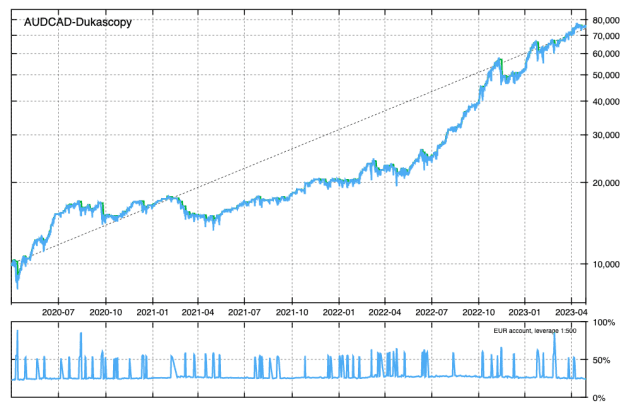
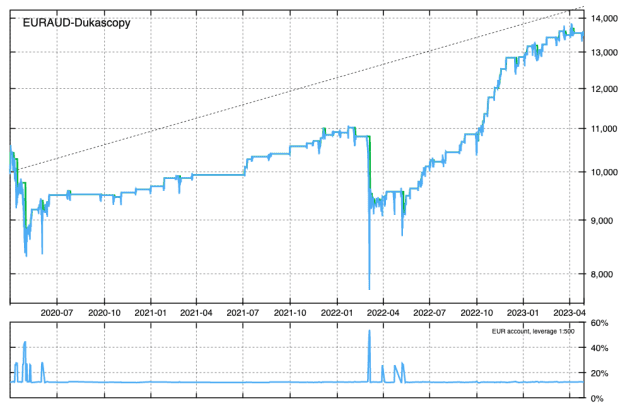
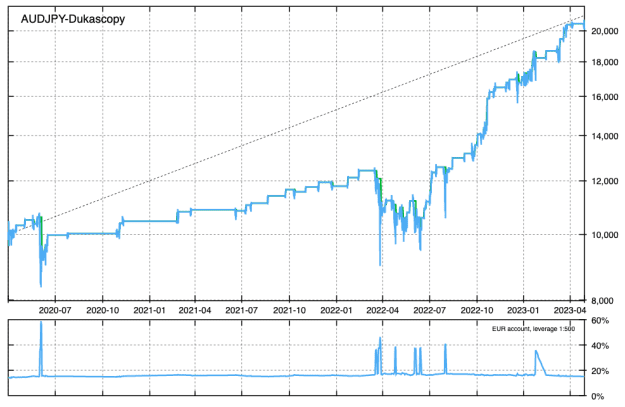
Good question. I have two answers to that. First, you never trade 1 strategy/setting, you trade a whole portfolio. Other settings or other symbols might already have given profit earlier. Here are some other symbols with the same EA: AUDCAD, 32+ ...
A Simple Mean Reversion Strategy
- yoriz replied Aug 20, 2023
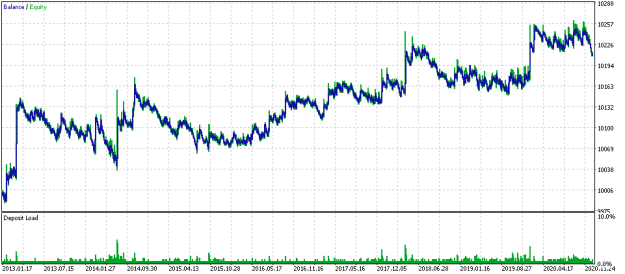
Inspiring topic! Thank you @Riskcuit! I wrote a simple Expert Adviser* following the basic rules from the first posts: - SMA200 - RSI14 - Scale-in only if SMA200 breached entry price of last trade - Close entire basket of trades when price crosses ...
A Simple Mean Reversion Strategy
- yoriz replied Jul 6, 2023
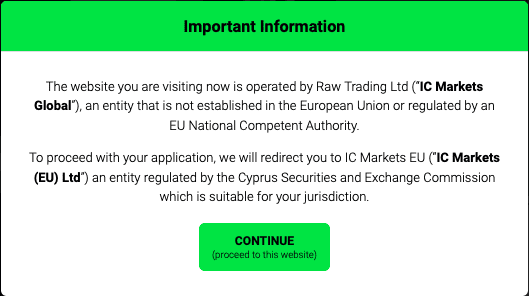
Not within the EU. For example ICMarkets has two websites. The regular icmarkets.com website, and the EU version icmarkets.eu. When I visit their .com website from a European IP address, I am given this popup: image and get redirected to the EU ...
This guy is a Mean reversion monster trader
- yoriz replied Jun 22, 2023
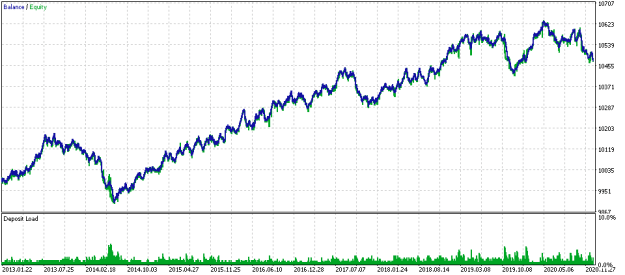
For reference, here is USDJPY with an averaging DOWN strategy: image Unfortunately both curves look correlated. Especially 2014-07 is a bad month for both with a strong peak in deposit load. Running both strategies together will not help us get a ...
The Myth of Averaging
- yoriz replied Jun 22, 2023
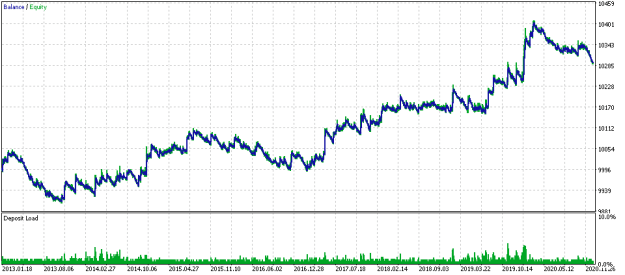
Thanks for the suggestion! Here is USDJPY with an Averaging Up strategy: image
The Myth of Averaging

- yoriz replied Jun 22, 2023
This is the best I can make of EURUSD: image At least equity is going North, but certainly not as convincing as the averaging down equity curves we have seen.
The Myth of Averaging
- yoriz replied Jun 22, 2023
Level 3 optimization gave: L3_ScaleInPoints=200, L3_TrailingStopLossPoints=375. image I am giving up... Since AUDCAD is fairly ranging, perhaps this is not the best symbol to add to winners and follow trends? Let's try EURUSD now...
The Myth of Averaging
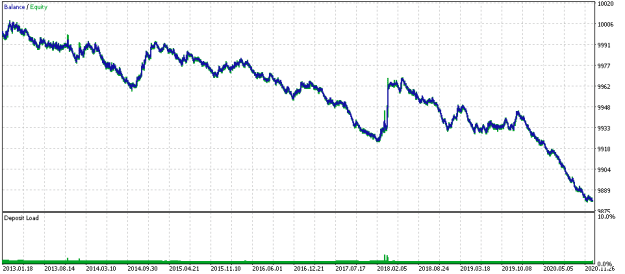
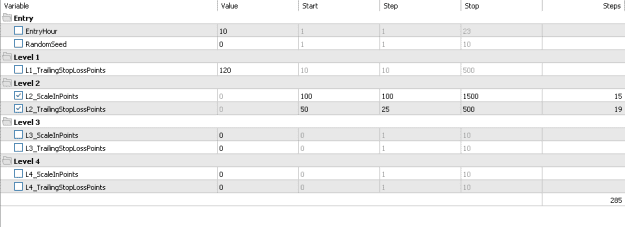
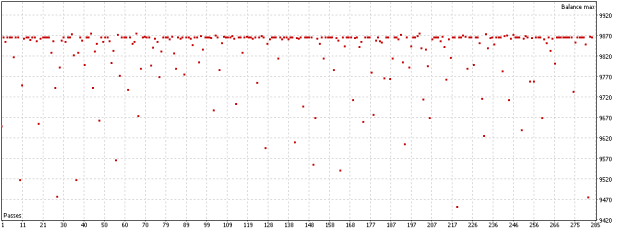
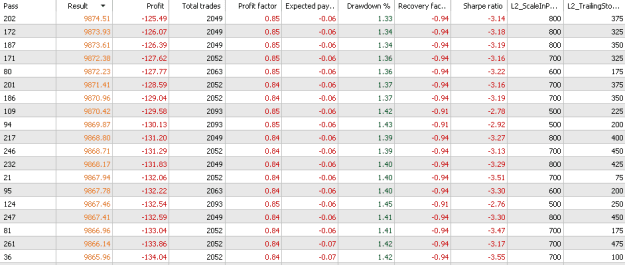
- yoriz replied Jun 22, 2023
Next step is the Level 2 settings: image I am a bit disappointed in what this gives me: image image Hardly an improvement over Level 1... The "best" setting is L2_ScaleInPoints=800, L2_TrailingStopLossPoints=375: image image
The Myth of Averaging
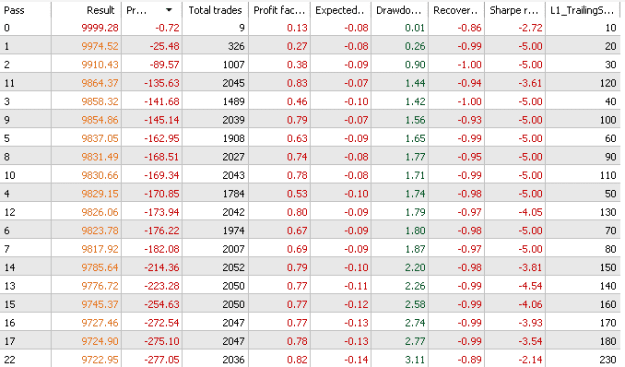
- yoriz replied Jun 22, 2023
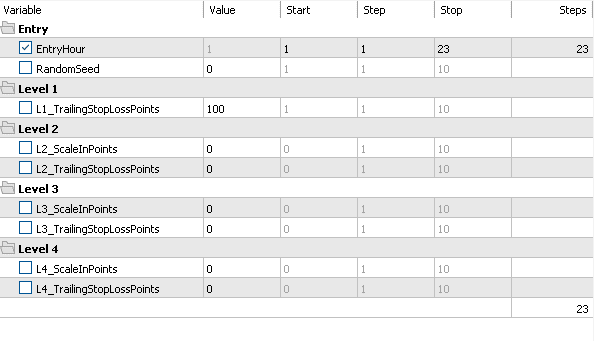
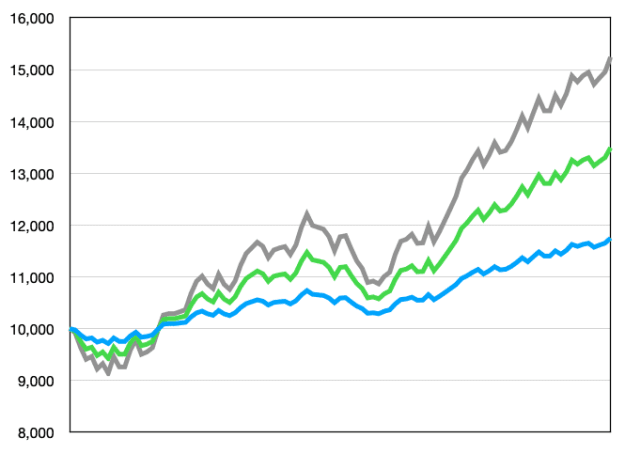
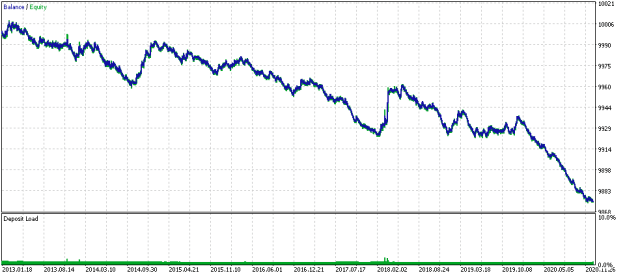
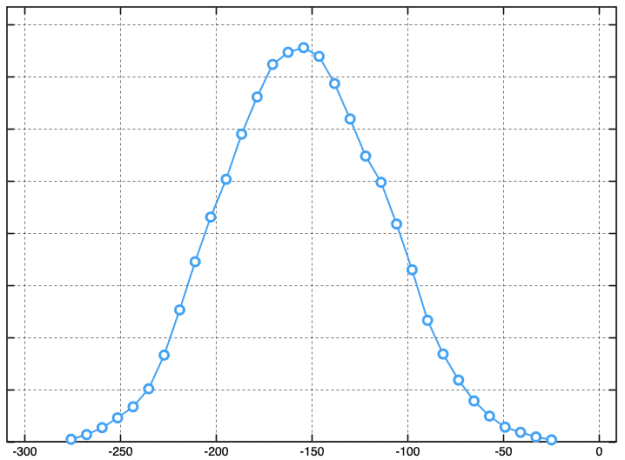
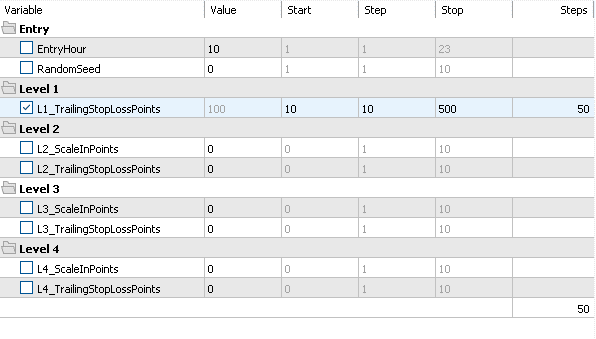
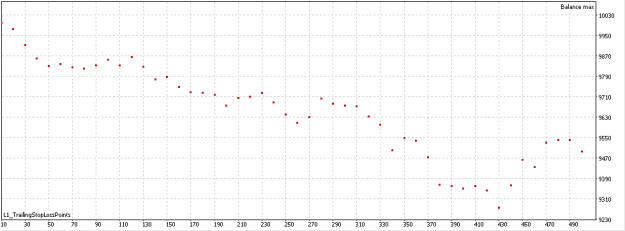
Now we are going to hunt for a good L1_TrailingStopLossPoints: image This gives the following results: image image Hmm, this is awkward. The best is L1_TrailingStopLossPoints=10, but we don't want to build a scalper EA that is trailing at 1 ...
The Myth of Averaging
- yoriz replied Jun 22, 2023
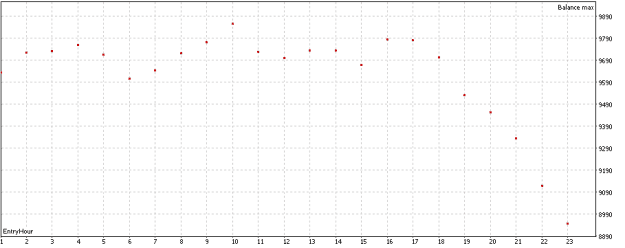
Ok, let's start trying out this thing... First let's choose a good time of day to enter the market. We optimize "Balance Max" for EntryHour: image All terrible performance and not much difference: image So let's choose EntryHour=10 for now and ...
The Myth of Averaging