- Search Energy EXCH
- 350 Results (1 Thread , 349 Replies )
-
 xxDavidxSxx replied Oct 27, 2007
long and holding — I have no clue what is comming next. I thought it would have broke to the top of this channel its in at the end of last week. Now I am beginning to wonder. I have the yellow target box at the 161.8% and the top major trend ...
Cable Update (GBPUSD)
- xxDavidxSxx replied Oct 23, 2007
Ok I forgot I posted this here. I knew it was somewhere. The possible wedge I posted above looks to be holding for now, as price slammed against the bottom red wedge line and took a 100+ pip bounce. Now currently trying to work past the 61.8 fibo. ...
EUR/USD Trading Room

- xxDavidxSxx replied Oct 22, 2007
I have been using pitch forks alot lately and they've become a regular part of my trend lines. They'll explain why a price suddely stops and bounces for seemingly no reason. Today a median line from a mid term scale got in the way. The price looks ...
Dollar.....Whats Next??

- xxDavidxSxx replied Oct 19, 2007
The red range marks the possible diagonal triangle range that could develop over the next few days. The first top looks to be at 1.4385 range. The end of the triangles range is 1.4500. This could also be called a truncated wave 5. If so each wave ...
EUR/USD Trading Room
- xxDavidxSxx replied Oct 17, 2007
Looks like thats as far as that correction is going down. A clear a,b,c side ways correction has formed. This thing should be going for 1.4500 range. Dave
EUR/USD Trading Room
- xxDavidxSxx replied Oct 13, 2007
Here is a bullish Gartly forming on the 4 hr chart. This will precede the bearish butterfly I pointed out could form. The news on friday was nothing more than intra-day market niose. After it was all said and done, the price structure remains in ...
EUR/USD Trading Room

- xxDavidxSxx replied Oct 11, 2007
Here is the current chart I am working off of. Looks like a butterfly about to form. We need a near 38.2 retrace just below median line, then bounce to a slightly new over all high at that top weekly trend line, then look out below! I agree with the ...
EUR/USD Trading Room
- xxDavidxSxx replied Oct 11, 2007
Entry level achieved. Now lets see if it confirms and signals a short entry. Looking for ST trend lines to be broke, and a couple ma cross. Dave
EUR/USD Trading Room
- xxDavidxSxx replied Oct 9, 2007
Heres my current view on euro$. When indicators become crossed, flat, or uncertain, revert back to basic trend lines and rules, and how you have come to know a pair to act. The yellow entry box falls between the 61.8 and 76.2 fibos. This is also ...
EUR/USD Trading Room

- xxDavidxSxx replied Jul 29, 2007
C-mon guys, view this as technical analysis's. What this chart is telling us is that this low volitity is nothing new. As a matter of fact, it has marked major turning points in the over all market trend. I plan to hold these positions a long time. ...
EUR/USD -Market Gap

- xxDavidxSxx replied Jul 29, 2007
Here an example of adding to a winning position. Target range determined by wolf wave analysis. Dave
Day Trading vs. Swing Trading vs. Position Trading
- xxDavidxSxx replied Jul 29, 2007
I am a full time position/swing trader. Position trading is swing trading the over all greater trend. Only take trades in the direction of positive interest. While swing trading can make use of carefully planned s/l's. Position trading uses NO ...
Day Trading vs. Swing Trading vs. Position Trading
- xxDavidxSxx replied Jul 22, 2007
Over All Trend Direction — Hey all, I might start popping in here from time to time. I just in the past 6 months noticed this formation and started trading the forex dragon(gbp/jpy). This formation is known as a triangle/wedge. This signals ...
Daily GBP/JPY analysis

- xxDavidxSxx replied May 1, 2007
The point where all the red lones come together on the middle green trend line. The indicator puts all that on the chart. It does look buisy at first. I usually use price trender and hand drawn trend lines for entry. heres the current chart. And ...
Harmonic Wave Journal
- xxDavidxSxx replied May 1, 2007
Check out this one I am testing out. I already use price trender at the bottom. The one on the chart is golden_section v2.2. The name tells nothing of the indicator and its all in another language. Pretty cool looking. It draws a pitch fork with ...
Harmonic Wave Journal
- xxDavidxSxx replied Mar 4, 2007
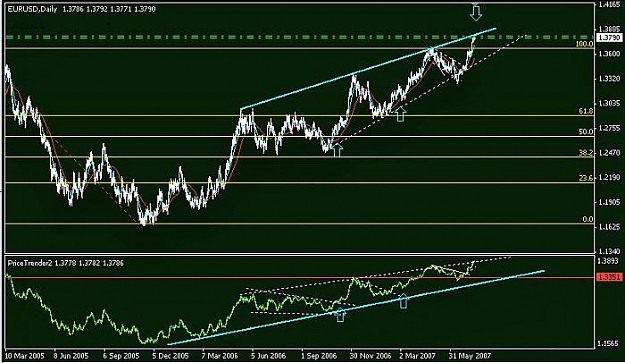
Over all trend update — Here is the chart on the over all trend. Price has broke out of a big wedge and pulled back and found support on the old top trend line. Now the trend has turned to the bulls. We could see a retest of the 1.3300 range. ...
My trades by Dave
- xxDavidxSxx replied Mar 4, 2007
Lunar cycles — Here is the current lunar cycle chart. We have a full moon this weekend. Based on this chart we should see the euro$ swing up the first part of next week. Dave
My trades by Dave

- xxDavidxSxx replied Feb 25, 2007
last week was flat and uneventful. Highlighted in yellow circle. But price remains bullish according to trend lines, and price trender. Price trender poked below top trend line but jumped back above it, making it bullish. *Buying on dips near top ...
My trades by Dave
- xxDavidxSxx replied Feb 20, 2007
Fixme1too mentioned the moon in trading. Got me interested so I read up on lunar trading a little. This is what I have on it. Very basic. Look for reversal around the new moon and full moon phases.(+/- 2 days.) Theres more to it, and I'll read up. ...
My trades by Dave