- Search Energy EXCH
- 5 Results
- w1nner replied Nov 11, 2011
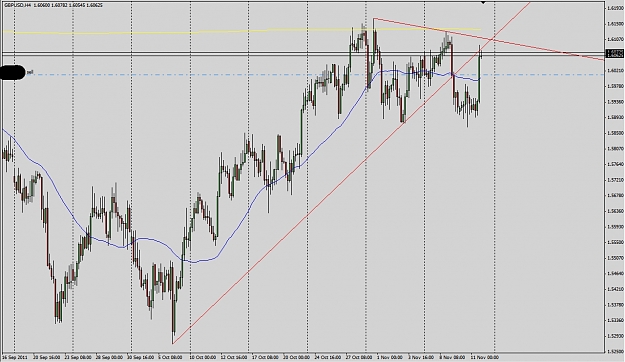
I read your post more than once. Thanks for your detailed answer and analysis. I attached my 4H chart, the blue line is the 40 SMA, the yellow line is the 1200 SMA which is equivalent to the 40 SMA on the weekly chart (the top of the daily candle ...
EurAnalysis
- w1nner replied Nov 10, 2011
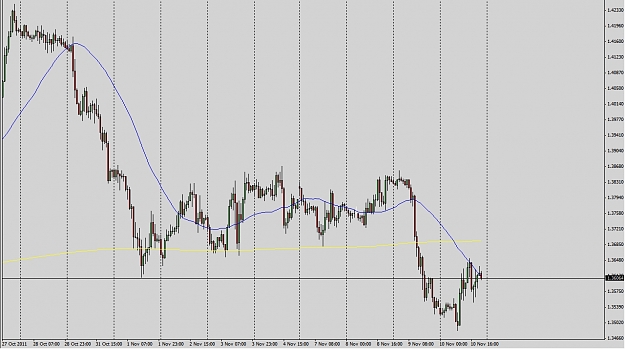
Yes, I understand. You wait for a pullback to the 200SMA (now is the supposed polarity). I attached the hourly chart with 800SMA (same as 200SMA on the H4) and 40SMA. Now the 40SMA holds the price. I would feel better to short from 1.37200-1.37900. ...
EurAnalysis
- w1nner replied Apr 9, 2011
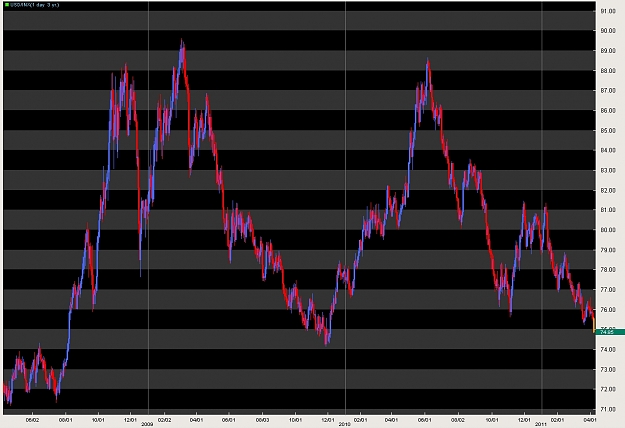
You are right and I was very wrong with my analysis not taking account of this fact. Although I monitored the weekly chart I saw that almost half candle closed upper than halfway. Next week was also very strong. It costed me a lot that I was so ...
AUD/USD
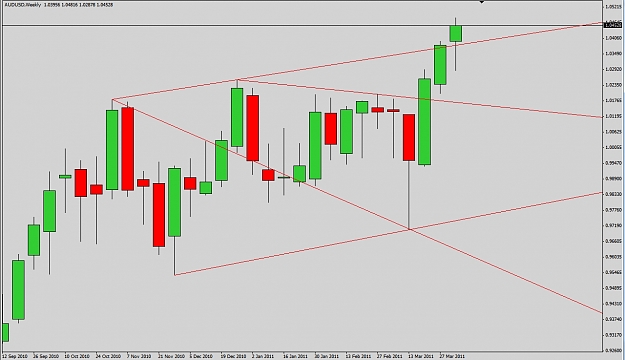
- w1nner replied Apr 7, 2011
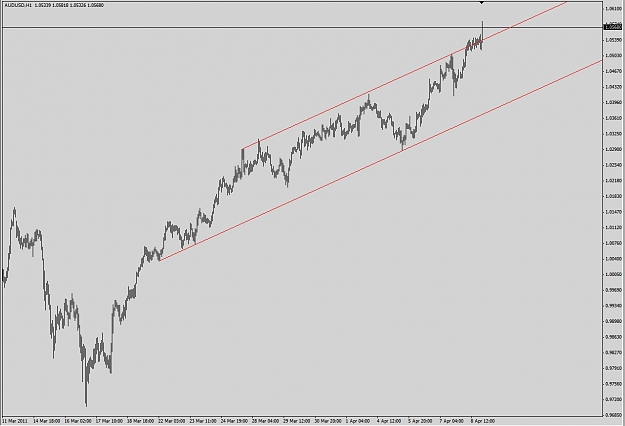
Thx! I wanted to post this image. There is a plus line but that is not important. So the current bars are above the upper line. (It was taken some hours ago.)
AUD/USD
- Posts by Member Search: 'w1nner'