- Search Energy EXCH
- 28 Results
- tweezer replied Dec 14, 2021
Hi coders. I was wondering if this is achievable. I need a gatekeeping EA that can modify the trade direction of other EA's based on few external indicators. For example if the trend is up, then EA should only be allowed to trade long. I'm willing ...
I will code your EAs and Indicators for no charge
- tweezer replied Sep 20, 2020
Hi, able to code a calculation for time frame selection like 1m, 5m, 15m, 30m, 1H? Thanks in advance!
I will code your EAs and Indicators for no charge

- tweezer replied May 9, 2014
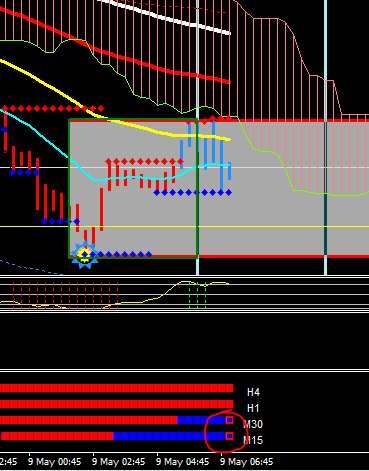
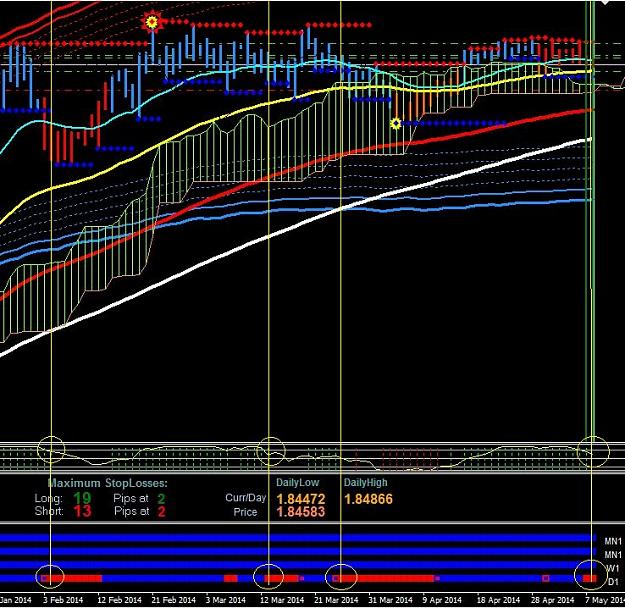
Broken to the upside. If she can maintain closure on top then the next hurdle is to survive the news and break out of the cloud. Still looking for short trade setup until higher TF has confirmation for bull.
Cable Update (GBPUSD)

- tweezer replied May 9, 2014
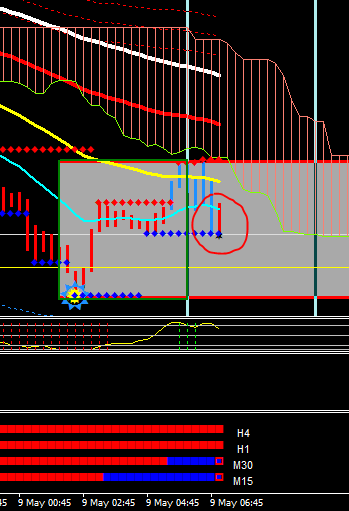
Long is still risky considering the recent price movement. Only looking for short trades (when candles turn red and break support). If this doesn't happen then it's a no-trade day.
Cable Update (GBPUSD)
- tweezer replied May 8, 2014
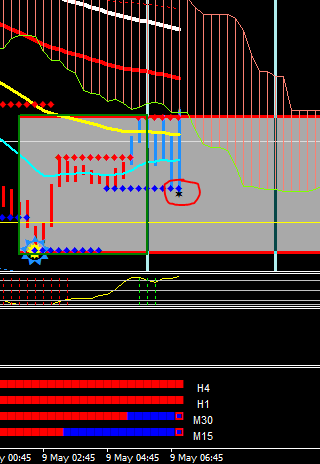
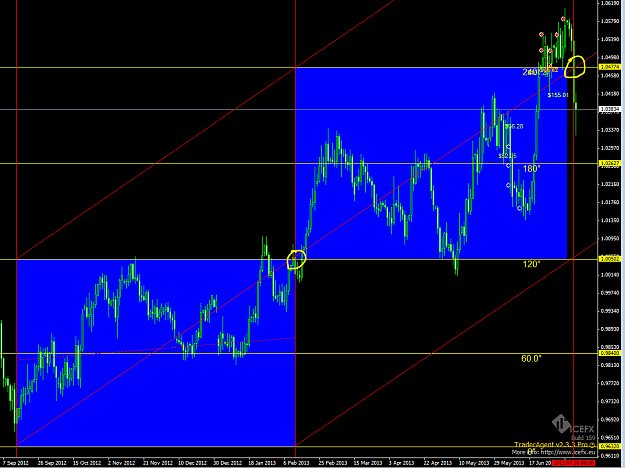
To me, EU already breakout + 20 pips. Now to re-test the previous high and break through
Cable Update (GBPUSD)
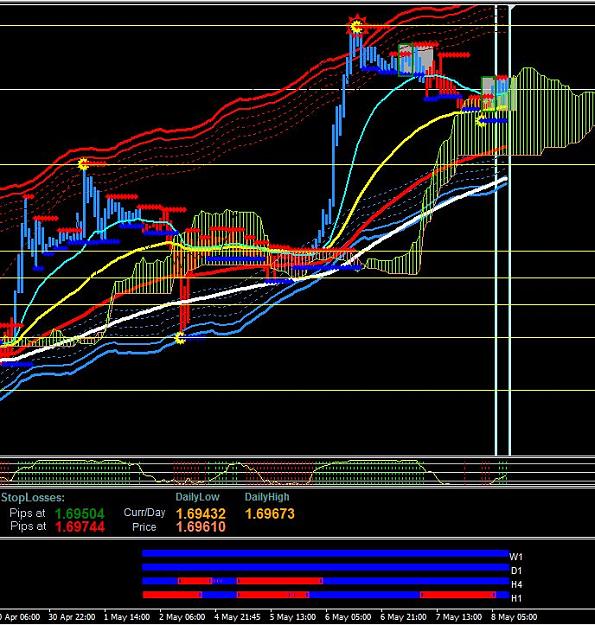
- tweezer replied May 8, 2014
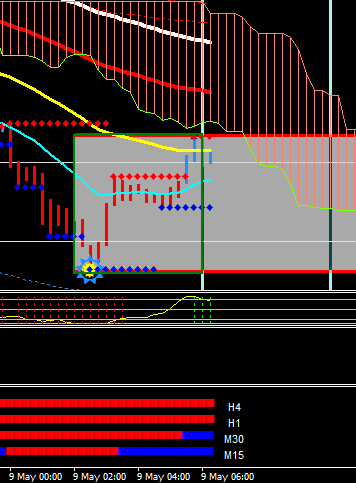
GU 1H chart- Failed to break above and outside of cloud?
Cable Update (GBPUSD)
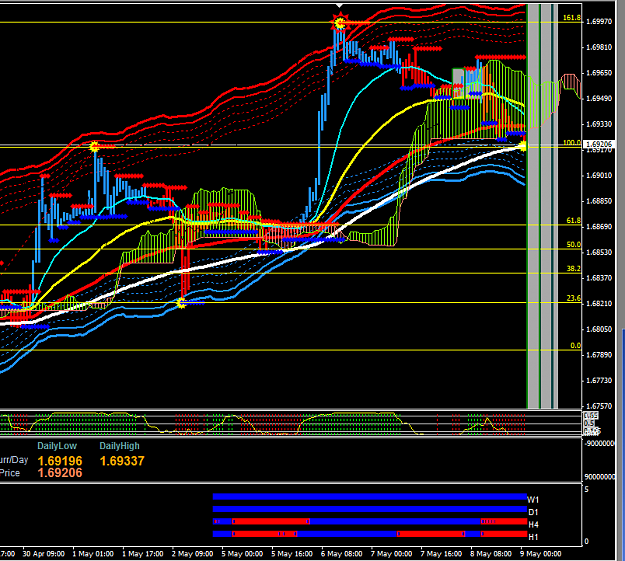
- tweezer replied May 8, 2014
I'm seeing strength in CAD. Currently holding GBPCAD short since last week despite the sudden spike. This is a daily chart with simple indicators- The up move has slowed down dramatically faced with strong resistance and the cloud is indicating ...
Cable Update (GBPUSD)
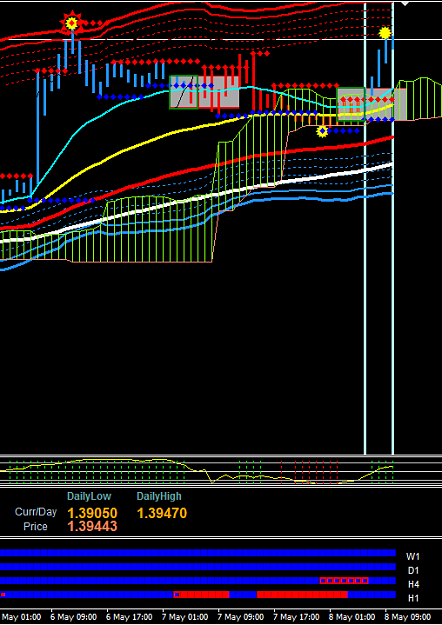
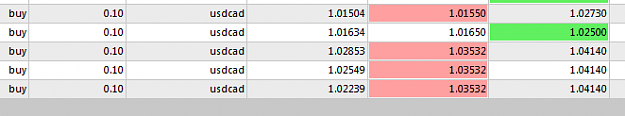
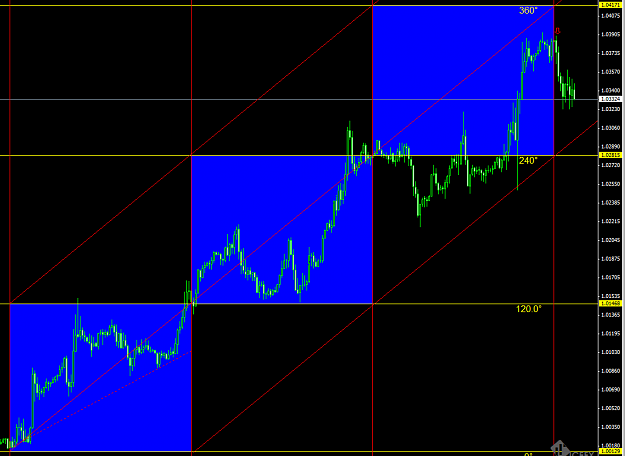
- tweezer replied Jul 11, 2013
Great entries. Yesterday marked the end of the 2/3 cycle and price respected the meeting point. We are now in the 3rd and final leg up.
USD/CAD
- tweezer replied May 31, 2013
Possible scenario on daily chart. Buying dips until end of cycle or 1.47 is reached. This might not be an optimal entry because I did not wait for price to revisit 1.026 first. Since we have up to July until the next station is reached, anything can ...
USD/CAD
- tweezer replied May 24, 2013
Sorry if I annoyed anyone. That was not my intention. I will stop posting about it. Safe trading everyone.
USD/CAD
- tweezer replied May 23, 2013
That was actually part of a bigger cycle if you are a swing trader. Attached is a daily chart. Target is 1.047 by 5th June 0:00. Around 2 more weeks to go.
USD/CAD
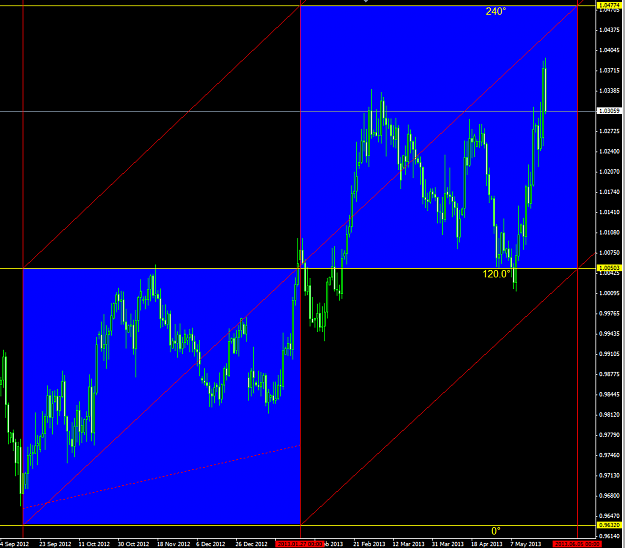
- tweezer replied May 23, 2013
Price in temporary corrective phase before further move. Cycle is still incomplete without 1.04. Will wait if bottom trend breaks.
USD/CAD
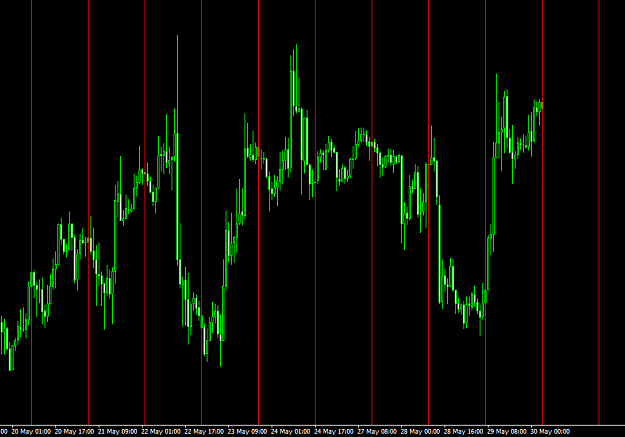
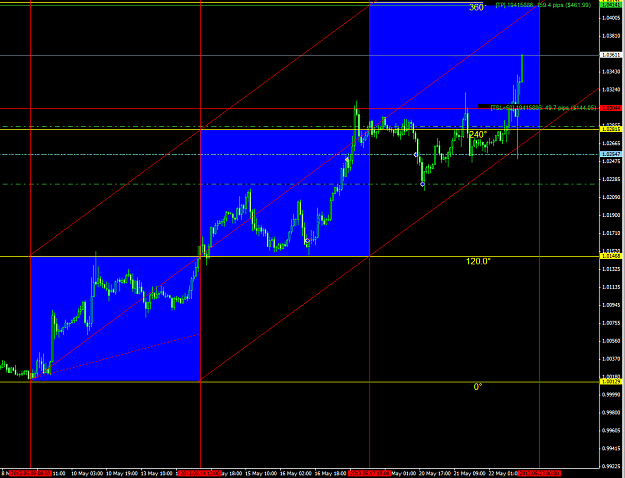
- tweezer replied May 22, 2013
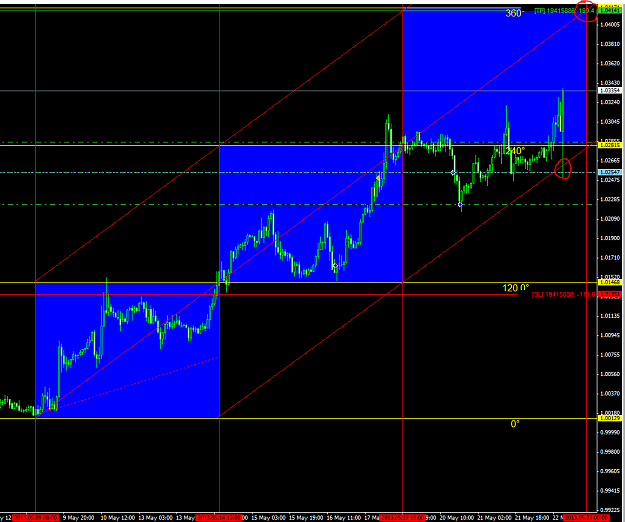
Trailing stop activated. Either time ends, price completes full cycle (360), or gets stopped out, whichever comes first. Trade safe everyone.
USD/CAD
- tweezer replied May 22, 2013
Cycle is still valid for the next 10 hours. After which a new form will take place. Perhaps a good place to start shorting
USD/CAD