- Search Energy EXCH
- 24 Results

- tomase replied Feb 25, 2019
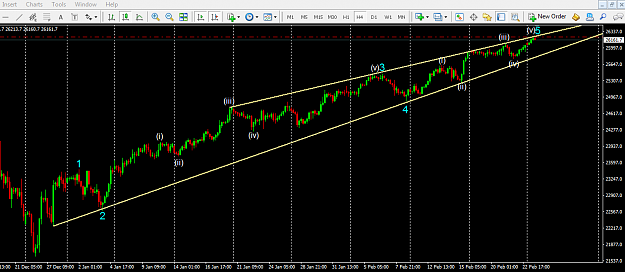
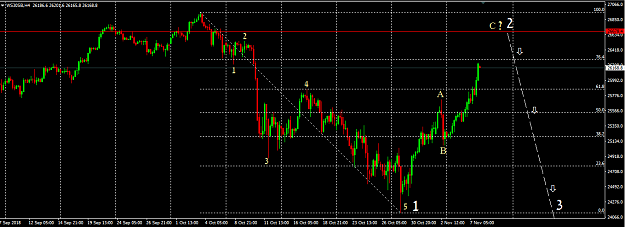
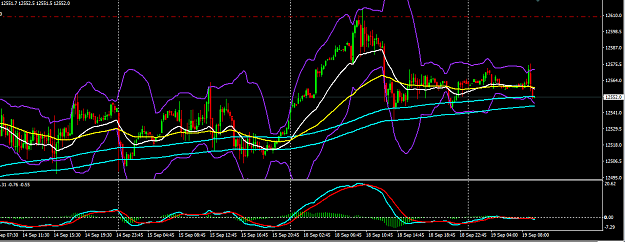
The Dow has pulled back off a fifth touch on this rising wedge and this wave count - for what it's worth, any comments more than welcome - prompted me to pull the trigger on a short at 26222.
US and Euro stocks mounting one more rally before crashing?
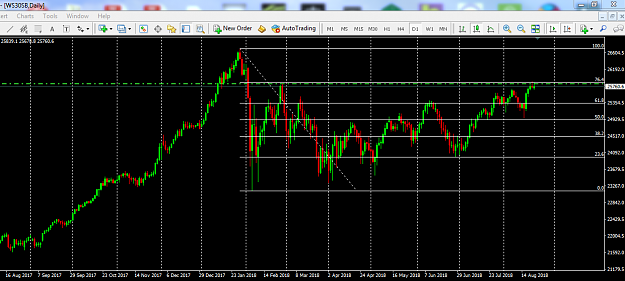
- tomase replied Feb 1, 2019
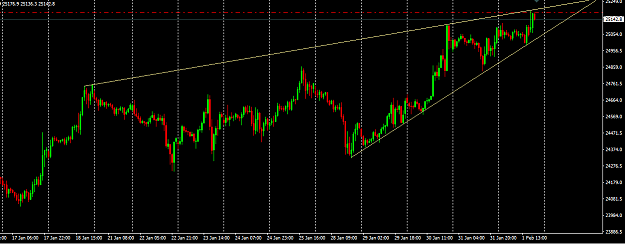
I'm not certain that this is an ending diagonal on the Dow in the truest sense - over to you medici - but it certainly fits and is added confluence to cat's trendline from the Oct high. Plus there was a clear final 5 up on the M1 from just before ...
US and Euro stocks mounting one more rally before crashing?
- tomase replied Nov 24, 2018
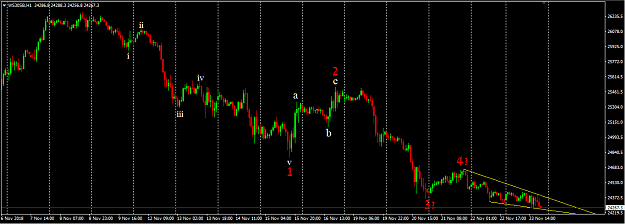
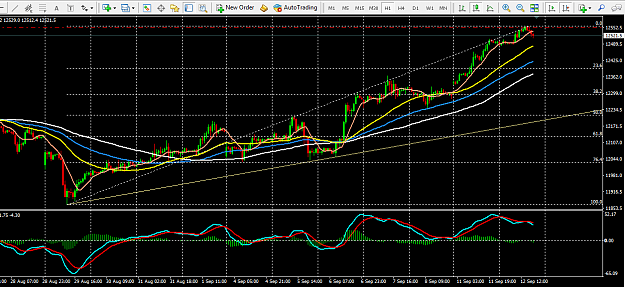
Just my 2 cents as a very amateur elliotician. I'd agree with that wave count stringfx - it looks to me on the D1 as if the Dow is in wave 3 of 3 which is probably the most powerful wave of all. If that is correct then much lower prices lie ahead ...
Elliot Wave Analysis
- tomase replied Nov 9, 2018
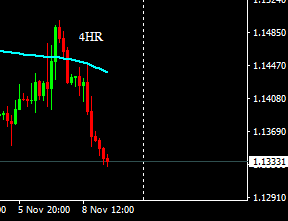
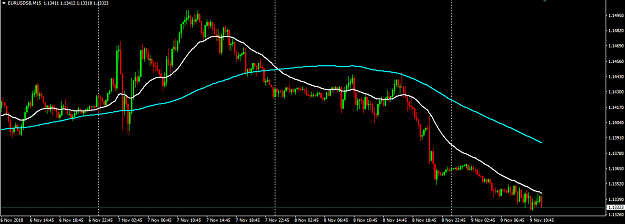
This is a simple - and I believe well known multi timeframe strategy. Look for a trend on the 4HR on a currency pair or index and take entries on the 15min pullbacks using whatever ma's you find act as support/resistance on the 15min. Here is an ...
Can there be a strategy that only works on particular timeframes?
- tomase replied Nov 7, 2018
Just to add to your projection of the 26630 to 27000 area as resistance on the Dow (presuming it blasts through the 76.4 fib level), an EW projection would take it up to the 26680 area - the distance travelled in wave A (1600 pips) being equidistant ...
US and Euro stocks mounting one more rally before crashing?
- tomase replied Oct 4, 2018
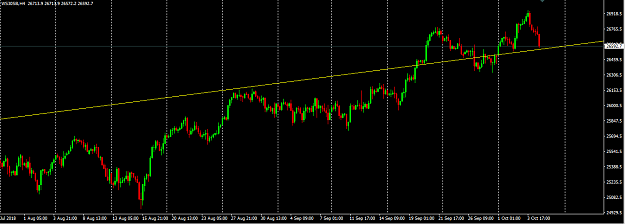
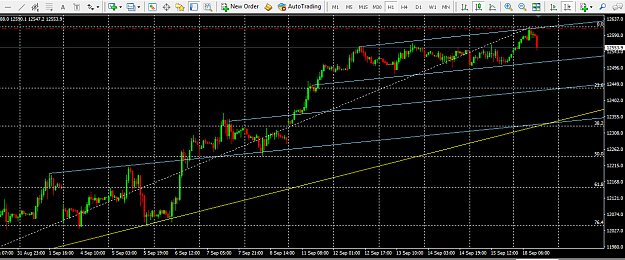
This trendline on the Dow - shown here on a 4HR - dates from the low on March 7th and has multiple touchpoints from above and below. It provided support in March and has contained all the highs on the way up and support again in this last ...
US and Euro stocks mounting one more rally before crashing?
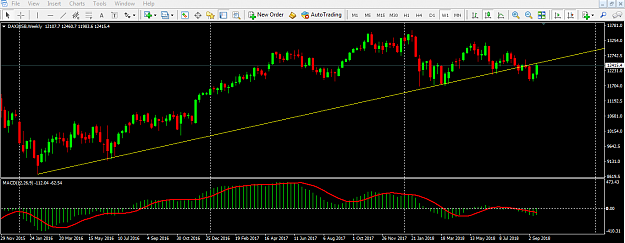
- tomase replied Sep 21, 2018
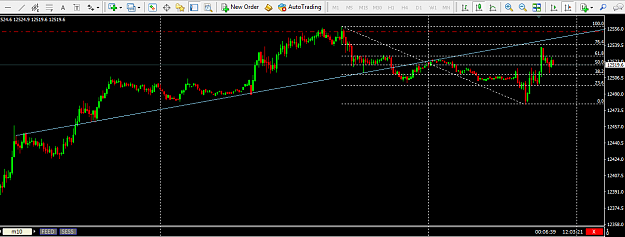
About to plant a "kiss" on this weekly trendline dating back to 2016.
US and Euro stocks mounting one more rally before crashing?
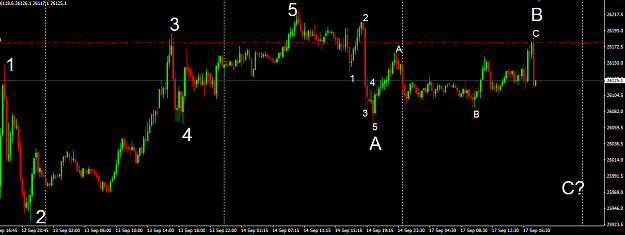
- tomase replied Sep 17, 2018
That's why I like to use EW. Because even though you can be wildly wrong in the bigger picture, if you correctly identify a 5 up (or down) in the intermediate or near term then there is a very high probability of an ABC correction in that time ...
US and Euro stocks mounting one more rally before crashing?
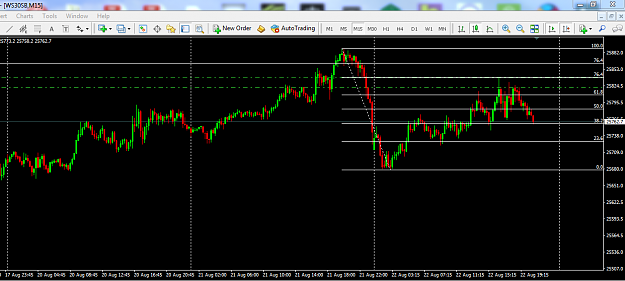
- tomase replied Aug 22, 2018
No I'm trading the cash/spot DJ30
Short Term Dow Jones 30 / DJIA 30 Trading Only
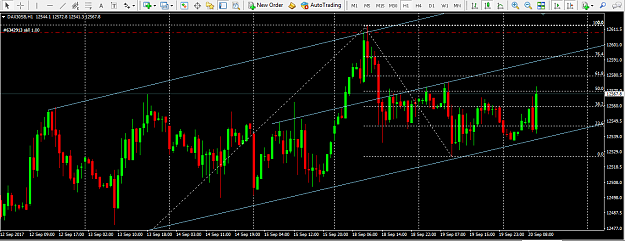
- tomase replied Sep 20, 2017
Here's another parallel tramline which price broke on the way down from the recent high but which has provided rolling resistance on attempts to climb back up. It would be just too perfect if that line held price during the FOMC this evening and ...
Dax - Daily analysis and Discussion
- tomase replied Sep 19, 2017
And to drill down lower, 25-30 pips were available on an aggressive trade at the London open on this 30sec timeframe.
Simple Scalping
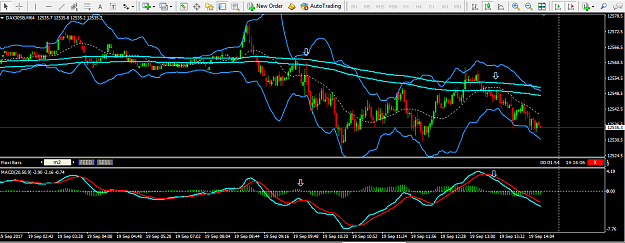
- tomase replied Sep 19, 2017
Further to post #220 - works great on a 2m timeframe as well.
Simple Scalping
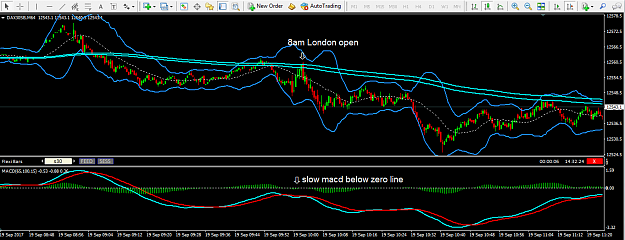
- tomase replied Sep 19, 2017
Hi Jenx - thanks for posting this simple scalping setup. I've been experimenting with it on a longer timeframe (15m Dax) with the BB deviation set to 3.0 instead of 2.0 and a slow macd. The smoothed 120 ma's provided effective support during the ...
Simple Scalping
- tomase replied Sep 18, 2017
Here's some wild conjecture and crazy projection on the Dax path and waypoints on its way down to the 38.2 fib - just for amusement and (my) wishful thinking!
Dax - Daily analysis and Discussion
- tomase replied Sep 13, 2017
This tramline with multiple touches from above and below might be useful to capture a short on the Dax if it pokes it's head above the 76.4
Dax - Daily analysis and Discussion
- tomase replied Sep 12, 2017
If this wave up has completed and even if it is wave 1 (which it's 694 pips certainly looks like) in a final 5 wave move up to make new highs, then it could/should pull back as far as the 50 fib before heading north again.
Dax - Daily analysis and Discussion
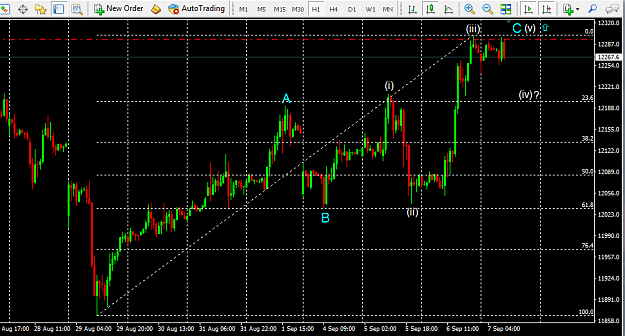
- tomase replied Sep 7, 2017
This might be a possible routemap for the Dax today and tomorrow. I think it is possibly in wave 4 (iv) of the larger C wave in this ABC retracement. This might go down to the 23.6 fib before Draghi comes over all dovish at 1.30 and sends the Dax ...
Dax - Daily analysis and Discussion
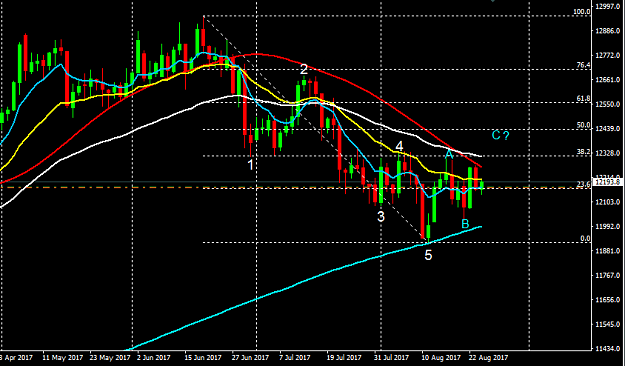
- tomase replied Aug 24, 2017
From a classic Elliot wave perspective off the daily, this could possibly be the route for the Dax over the next few days. If wave B to C is equidistant to the A wave off the Aug 11th low (as the theory goes) then price should reach the 12410 area ...
Dax - Daily analysis and Discussion