- Search Energy EXCH
- 14 Results
- tintin1 replied Apr 2, 2018
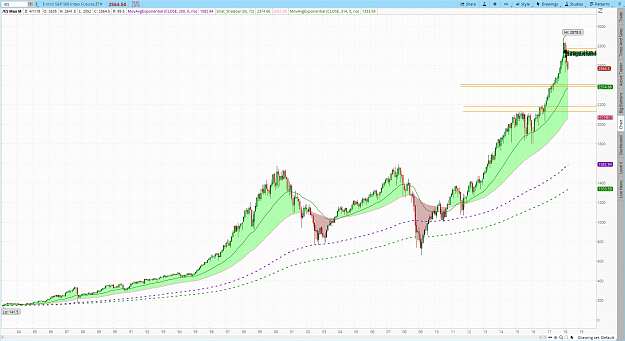
ES BB Analysis Due to the effect of selling in ES, i wanted to have a quick look at where things stand at big picture It hasn't made a LL yet so technically in uptrend Minor supports at 2480( Doji and bullish engulfing) and 2370(doji, insidebar ans ...
Strat's PASR Long Term, Stress Free Trading
- tintin1 replied Apr 1, 2018
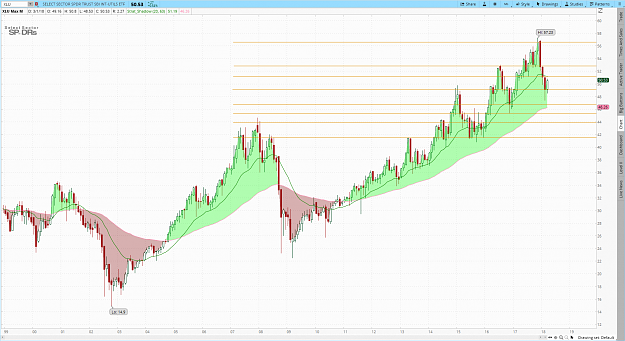
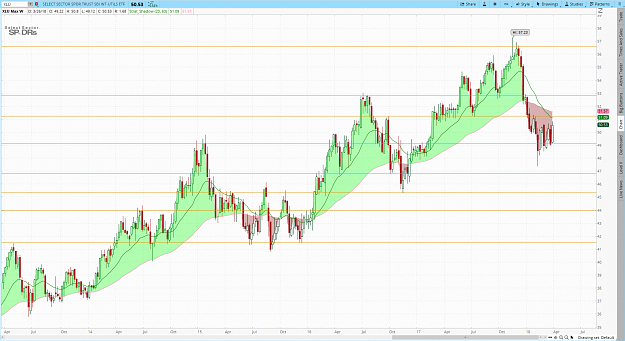
XLU - Utilities ETF BB : HH, HL lows so far so uptrend is intact. this could be start of the next impulsive wave after the corrective wave in the uptrend . Feb bar looks like an hammer at support and Mar bar is inside bar and strat shadow is acting ...
Strat's PASR Long Term, Stress Free Trading
- tintin1 replied Mar 26, 2018
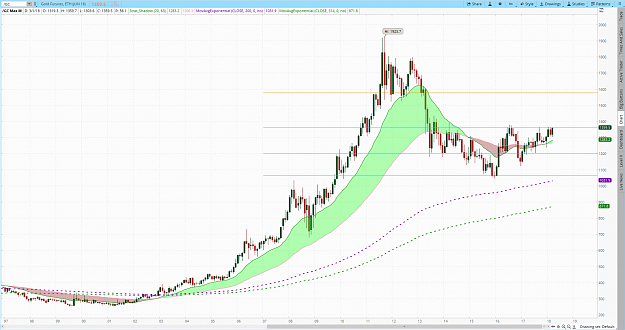
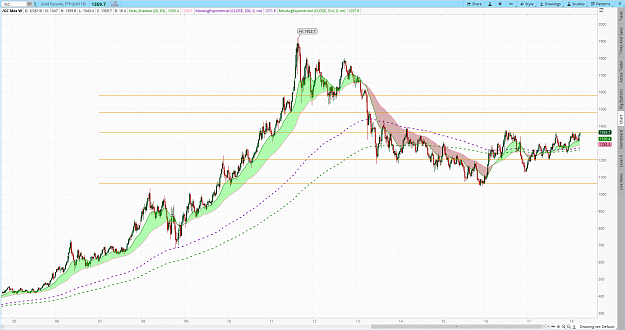
GC I think gold is on the verge of epic bull run if this works out If the Gold( gold futures) gains 1368 and then backtests it and holds than 1481 is 1st target and 1577 is 2nd target the chart says it all BB: price in immediate uptrend and above ...
Strat's PASR Long Term, Stress Free Trading
- tintin1 replied Mar 26, 2018
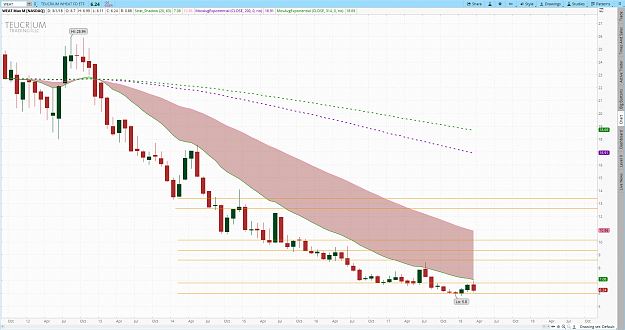
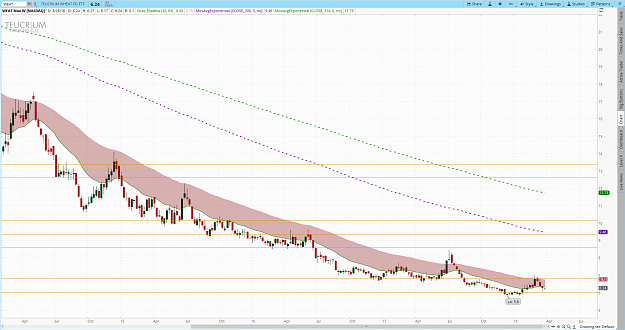
Follow up on the weat etf trade BB: is in long term Downtrend. immediate uptrend price hit the strat shadow resistance and dropping. 4 more days left for the monthly close . may close as Bearish engulfing bar or bearish outside bar B: Same long term ...
Strat's PASR Long Term, Stress Free Trading
- tintin1 replied Mar 14, 2018
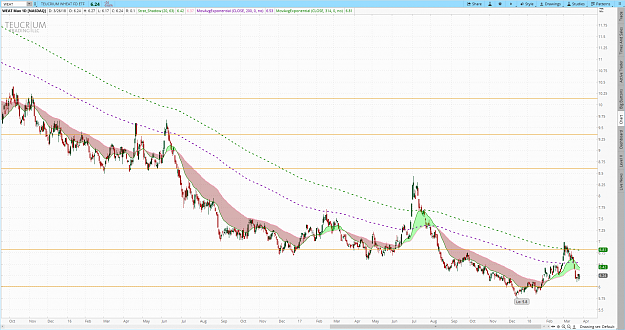
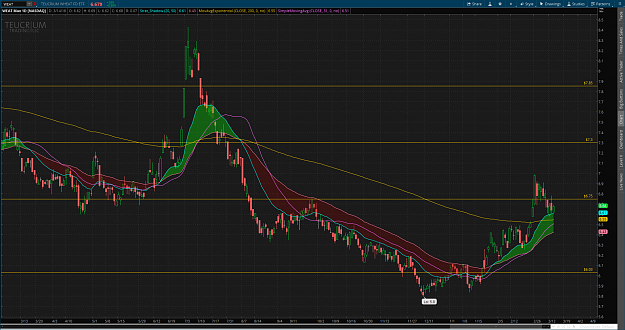
Here is my First post here. Took a WEAT ETF to analyse it will try to post atleast one analysis per week. I see this as opportunity to learn BB: is in long term Downtrend. immediate uptrend price is at strat shadow resistance B: Same long term down ...
Strat's PASR Long Term, Stress Free Trading
- tintin1 replied Nov 5, 2017
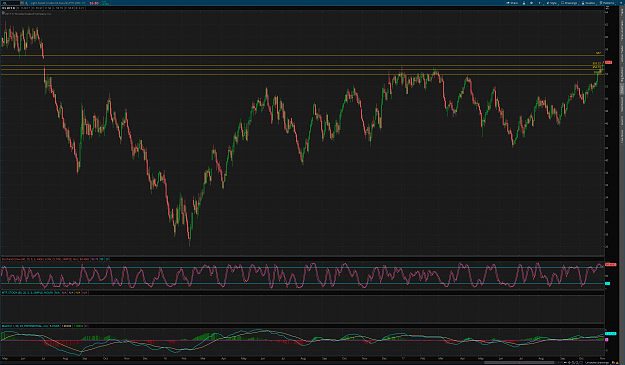
CL daily levels. Nice pop above previous R and back test and zone formation. looks ready to tag the next S/R level around 57
C-12's Supply, Demand and PA thread
- tintin1 replied Jul 8, 2017
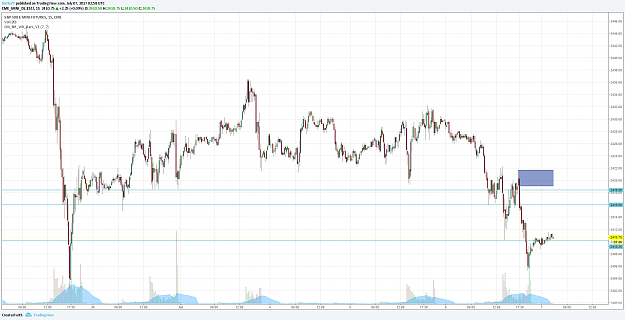
this one failed miserably, it went above the supply tested an imbalance area and flagging there unless it losses the flag( which will be bearish engulf) the PA looks like bullish to me. I may be wrong as Im novice in PA reading. I take touch trades ...
Price Will Tell - Supply/Demand Price Action Trading
- tintin1 replied Jul 6, 2017
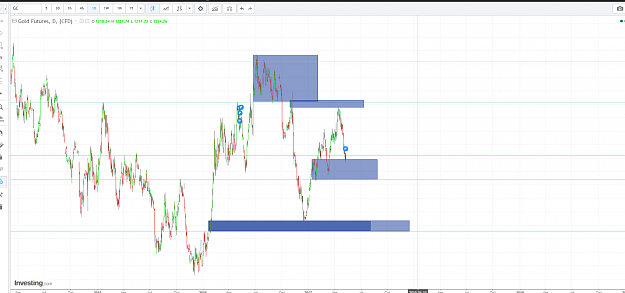
Currently looking at this supply area to short. the thick blue lines are BRL's image
Price Will Tell - Supply/Demand Price Action Trading
- tintin1 replied Jul 6, 2017
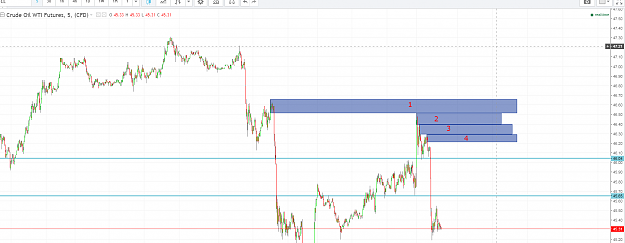
related to the above regarding a supply zone is tested or not and how immediately it tests the zone. i find the following CL 5 min chart interesting image the zone 1 is supply tested by zone 2 which makes it R then zone 2 is immediately tested by ...
Price Will Tell - Supply/Demand Price Action Trading
- tintin1 replied Jul 6, 2017
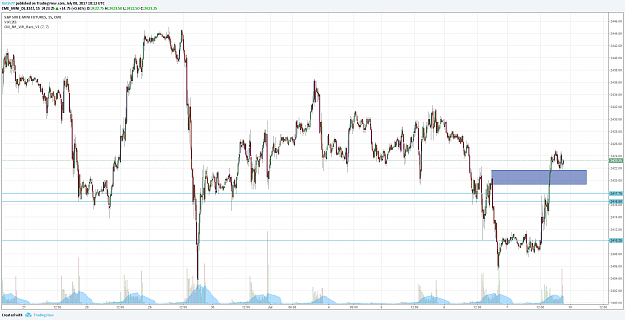
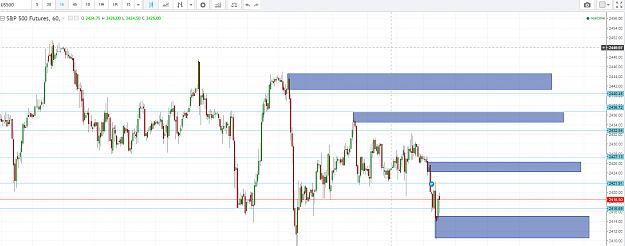
The Current ES levels in the 1hr chart as per my understanding of the principles discussed in this thread. your feedback is appreciated or just a word to let me know if im on the right track or not. Thanks image
Price Will Tell - Supply/Demand Price Action Trading
- tintin1 replied May 17, 2017
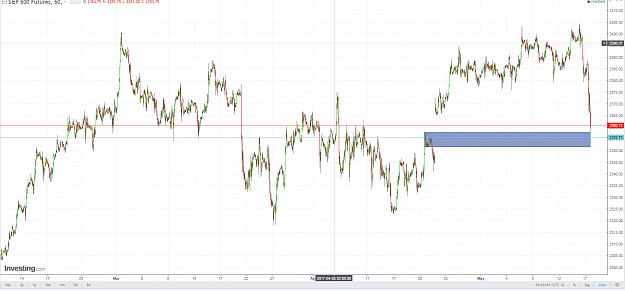
ES long this time image
ReadtheMarket - Supply and Demand with Price Action
- tintin1 replied May 17, 2017
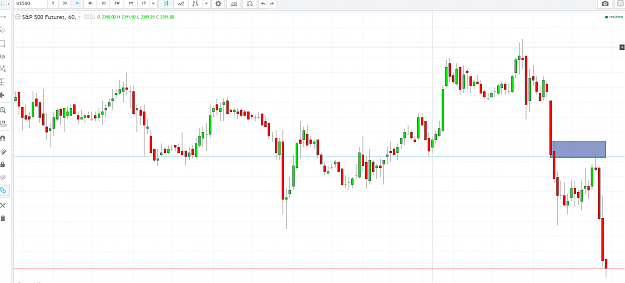
ES short for today image
ReadtheMarket - Supply and Demand with Price Action
- tintin1 replied May 11, 2017
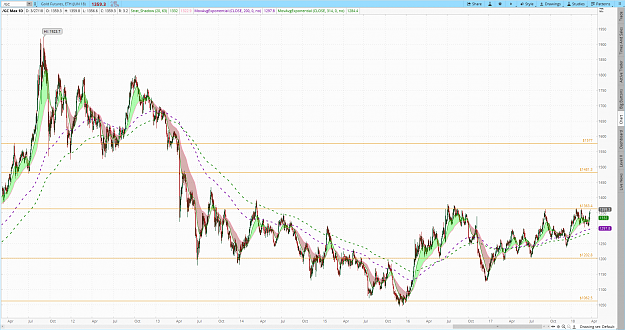
It is so quite in here. let me start one. here is GC chart daily comments welcome image
ReadtheMarket - Supply and Demand with Price Action
- tintin1 replied May 1, 2017
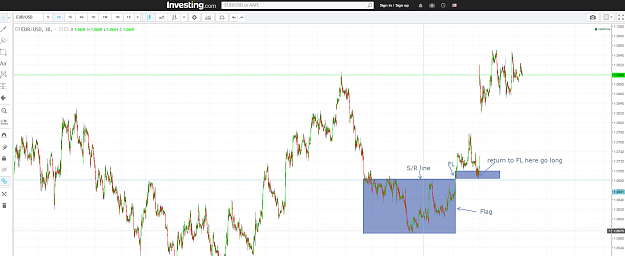
Albergo, on the 2 scenarios you sketched, the trade opportunity is only when the price returns to the FL right? not when they form the first time and pop or drop? a example here image
ReadtheMarket - Supply and Demand with Price Action
- Posts by Member Search: 'tintin1'