- Search Energy EXCH
- 26 Results
- shadowy replied Jul 18, 2022
image Has anyone else observed this recurring theme? reference YVZ and fib it. For today, price usually makes its high/low of day within a fib level of 2 or 3 of YVZ. or at times 1.5.
Prez Forex (pres78) Trading Journal
- shadowy replied Jul 6, 2022
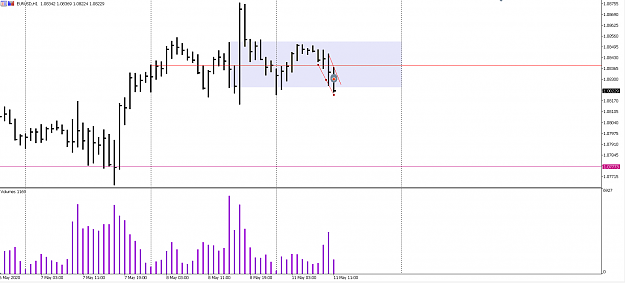
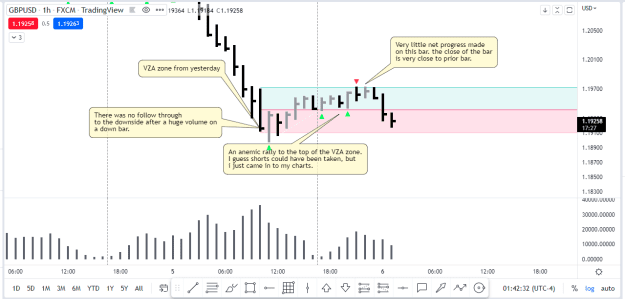
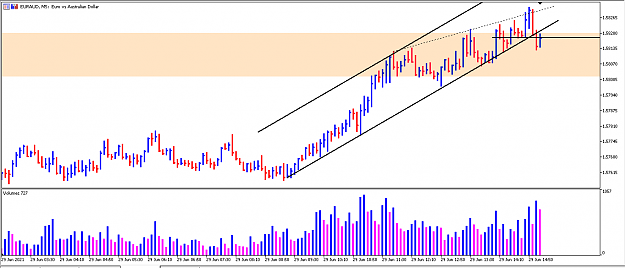
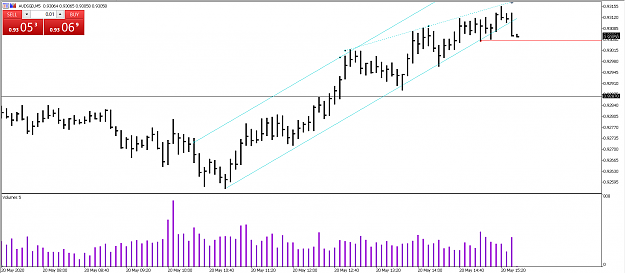
image Lets keep this thread alive hopefully. GBPUSD for the upcoming day. My bias is for it to further break down to get a retest and of the L or 50% to go short. But well, if it breaks above, then i'll be looking for longs instead.
Prez Forex (pres78) Trading Journal
- shadowy replied Jul 8, 2021
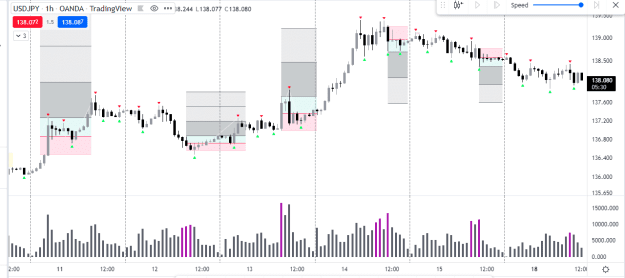
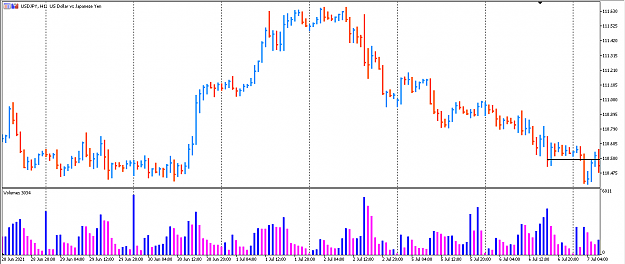
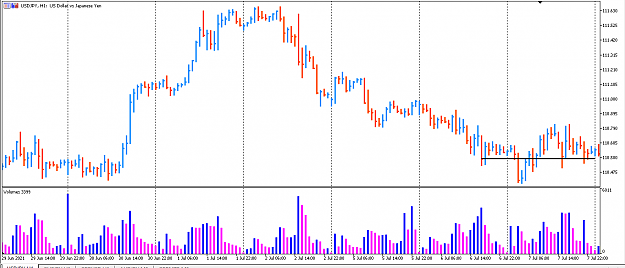
For educational purposes, Would you have taken this trade? this was from USDJPY yesterday. image i see a beautiful supply bar where i have marked with a black horizontal line. i wouldn't say this is buying volume since the next few bars all held ...
vsa with Malcolm
- shadowy replied Jul 7, 2021
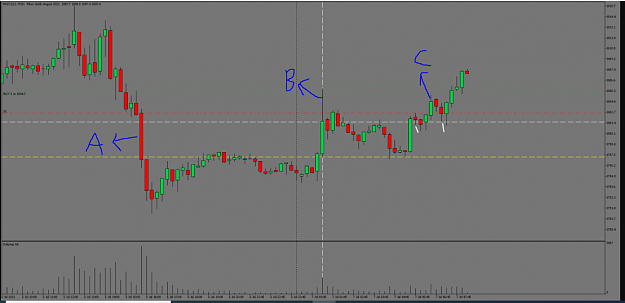
Nice trade. I've reproduced your chart with a few markings. Hoping to get your take on it. image Bar A was the highest volume on the chart on this bar. Even when Bar B came, where you have drawn your horizontal line from, the volume on bar B was ...
vsa with Malcolm
- shadowy replied Jul 6, 2021
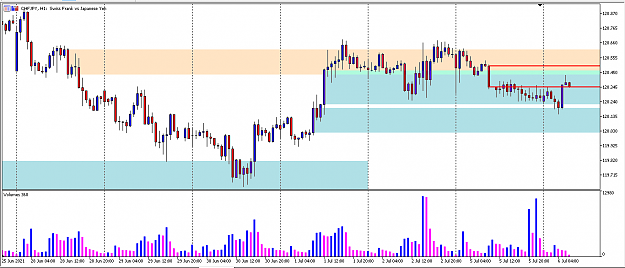
Hi guys, a quick question. Anyone trading using wrb zones? how would you trade a day like this? image This is CHFJPY. As we speak we are actually clustered in between 4 wrb zones. The zones shaded in blue are demand wrb bars. the ones in red are ...
vsa with Malcolm
- shadowy replied Jun 29, 2021
What i mentioned in the prior post. same thing again. a WRB bar from the 1H. in the 5mins, we have entered the zone. image A high volume bar stops progress to the upside. Notice the SOT(shortening of thrust) of swings right from the bottom of the ...
vsa with Malcolm
- shadowy replied Jun 29, 2021
Just wanted to share a trade that i took today. A very simple principal that i follow for my trades now. Seeing what you want to see, where you want to see. The main idea of this trade was framed around the posts made by "hiddengap(so credit goes to ...
vsa with Malcolm
- shadowy replied Jun 17, 2021
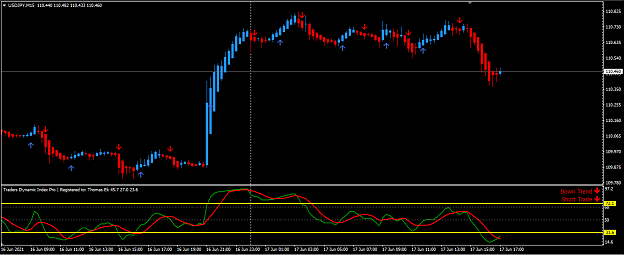
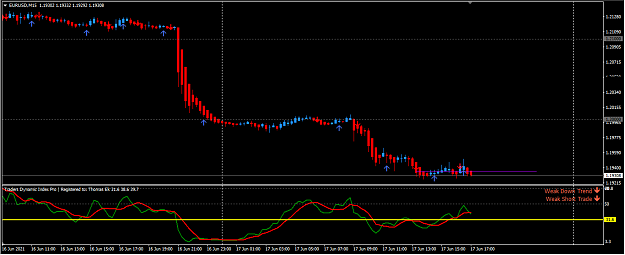
image USDJPY setting up. another 10mins to wait and see if a valid entry signal is given.
Synergy Strategy with TDI Pro
- shadowy replied Jun 17, 2021
image First trade in EUR. currently in red. lets see how this plays out.
Synergy Strategy with TDI Pro
- shadowy replied Jun 16, 2021
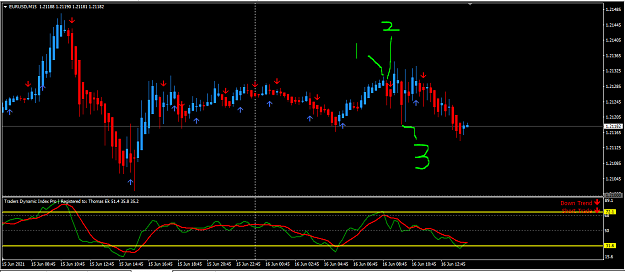
thanks for the answer. where would u have exited this trade though? image I understand that we take profit when in the TDI, both the green and red line cross the 72 yellow line. But in this case at point 1, the green line touched the 72 point but ...
Synergy Strategy with TDI Pro
- shadowy replied Jun 16, 2021
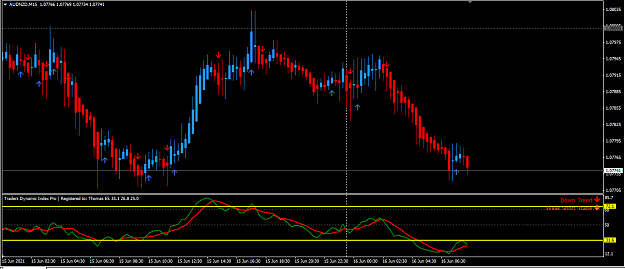
Thats strange. Do the arrows actually repaint or have i done any errors on my settings? The candle where i entered previously, the blue arrow seems to have disappeared after a few candles. image
Synergy Strategy with TDI Pro
- shadowy replied Jun 16, 2021
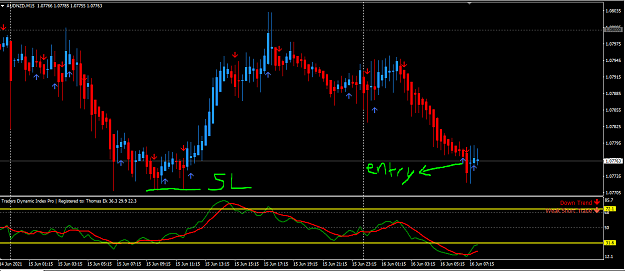
1st entry of the day. Long AUDNZD on the 15mins chart. Entry and SL as stated. A small drawdown initially. The SL in this trade was rather huge. Have entered on 2 positions. The plan is, 1st position i would close out after reaching TDI 50 and move ...
Synergy Strategy with TDI Pro
- shadowy replied Oct 26, 2020
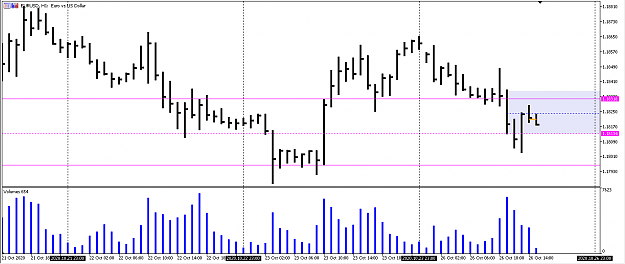
image stopped out of a trade today for a small loss. 5pips on 1 position, took two in total and a total loss of 10 pips Thus far. i'll skip the background conditions and get straight to the entry for this one. the pink shaded lines are a preszone ...
vsa with Malcolm
- shadowy replied Oct 21, 2020
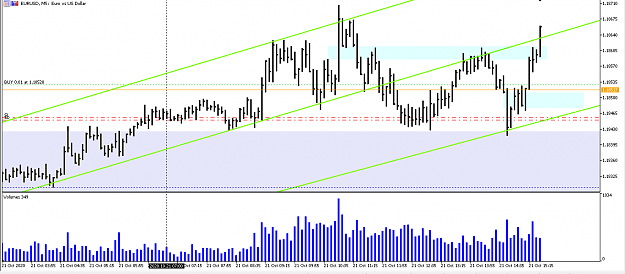
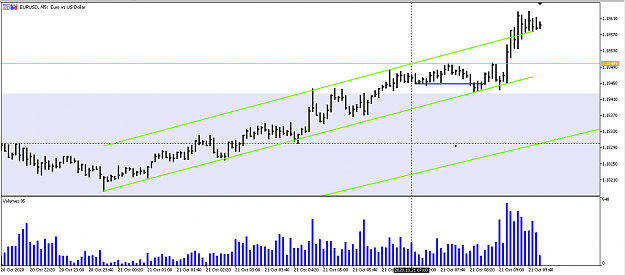
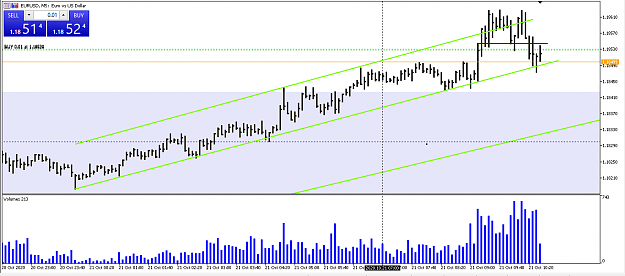
image I know i'm starting to sound like an old beaten record. but one last one for the day. this time utilizing the concept of WRB zones(credits to hiddengap). 5th last bar was my entry bar. reasons for entry, we are above pres zone, study of 1H ...
vsa with Malcolm
- shadowy replied Oct 21, 2020
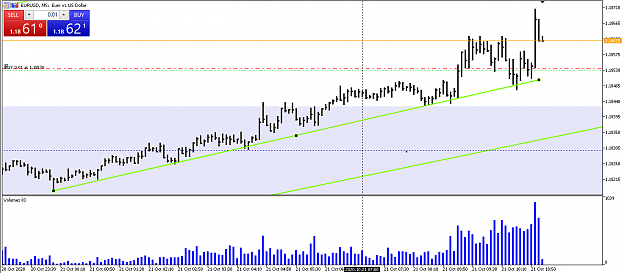
image 14 pips profit taken on 1 position, another position moved to breakeven. for those who haven't long, another opportunity presents itself, that orange line, flip level once again, Resistance turned support, should the PA look good, one can ...
vsa with Malcolm
- shadowy replied Oct 21, 2020
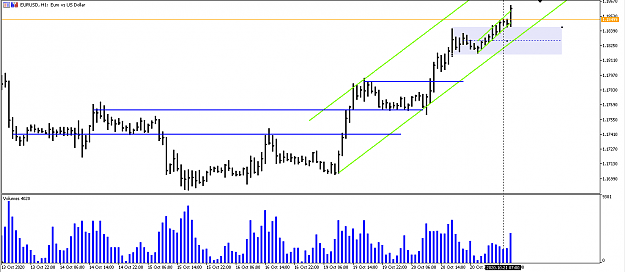
Waiting for LO and thought could post a chart. This is an amalgamation of a few methods i've learnt over the years. i didnt come up with these, i merely took what i felt comfortable with and merged them to form what i'm comfortable with trading. ...
vsa with Malcolm
- shadowy replied May 22, 2020
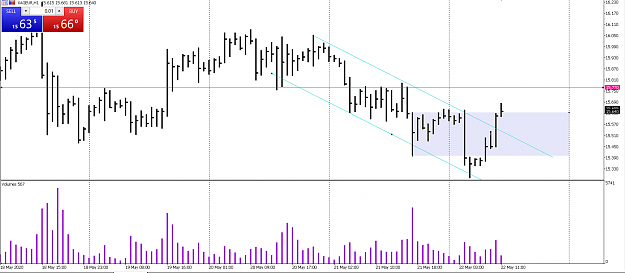
Possibly looking for a long. but have to be aware of the axis line just further up. this axis line should also pull prices so it acts as a magnet for my longs as well, a quick scalp perhaps. 1H background. broken a good down channel. was a valid ...
vsa with Malcolm
- shadowy replied May 20, 2020
Now, what caused my 1H bias to be short? last 3 bars in the chart. ignore the current bar as it has not closed yet. Almost similar volume, but look at the spread narrowing. and also we are right at a supply area which also happens to be yesterdays ...
vsa with Malcolm
- shadowy replied May 20, 2020
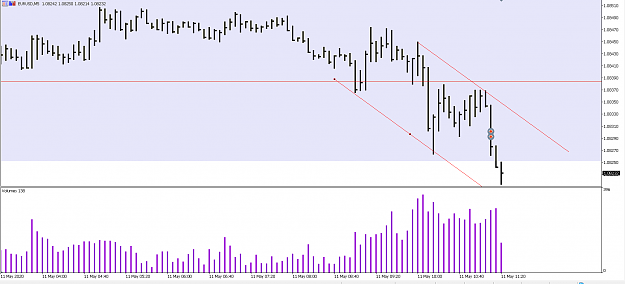
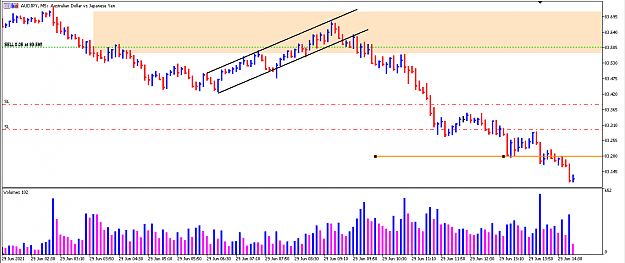
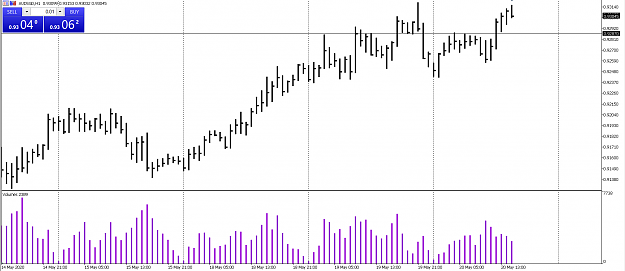
An exotic, just watching it for fun. A short setting up. The 1H background dictated direction for me. The 5min is my entry timeframe. we are in a mature trend as of now. breaking it with a good wide spread bar. Notice we had SOT(shortening of ...
vsa with Malcolm
- shadowy replied May 11, 2020
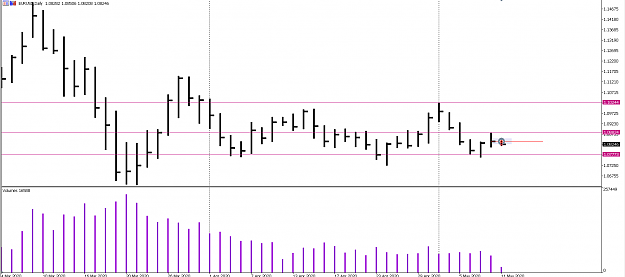
A short setting up for me in EURUSD. Daily chart: somewhat similar to my previous post. Bullish case: Clustering of closes right at the bottom swing point. Not much selling came in later at the top swing point, aka the top of AR rally. A Spring came ...
vsa with Malcolm