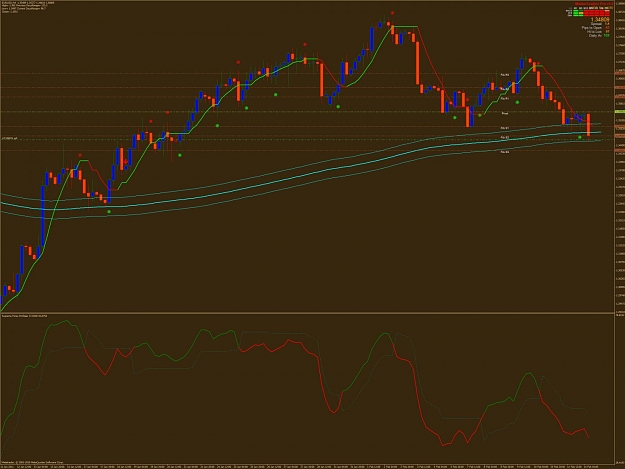
This is a 4 hour chart and it shows the pair back below the 233 MA which was 1.3250 on Jan 18 2011. If you go back in time when it drops below the 233 MA it goes quite a ways below. The middle blue line is the 233 MA. GL all
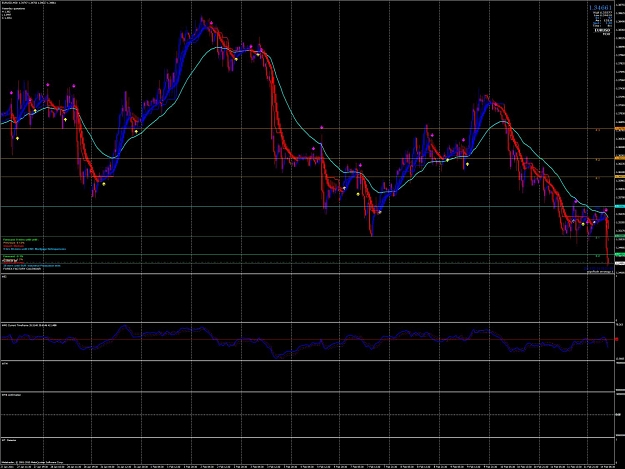
Here is what I am seeing
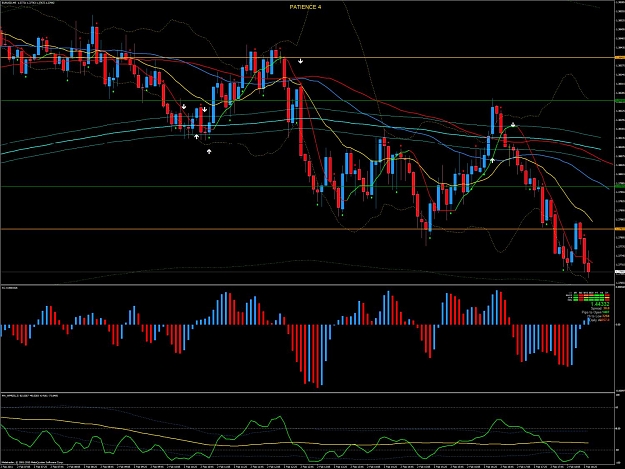
Looking much better than earlier. Showing lowere here. Added to my earlier short position. Everyhting is out of mother natures house now
showing lower