- Search Energy EXCH
- 5 Results
-
 saneblane replied Jun 18, 2014
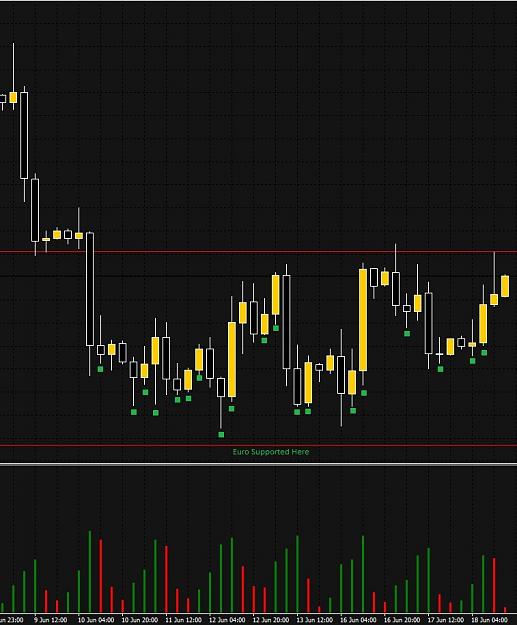
Edit: Sessions Not Days. I mixed up two words there for a second. This would give a better picture I guess of the imbalances supply and demand that exist at this level and some of the things that can be had from a chart. Mind you you don't have to ...
Looking for Real Trading Method
- saneblane replied Jun 14, 2014
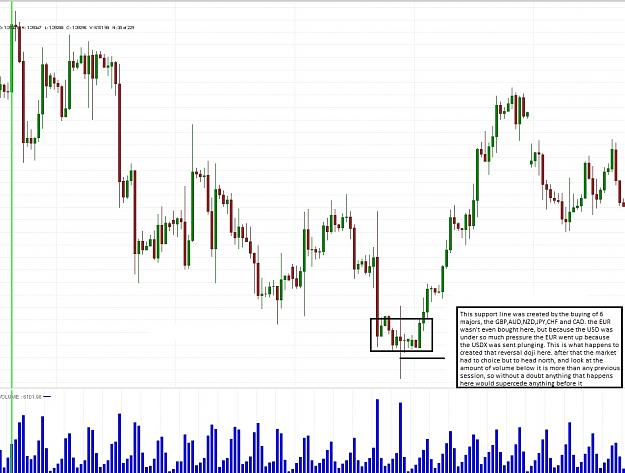
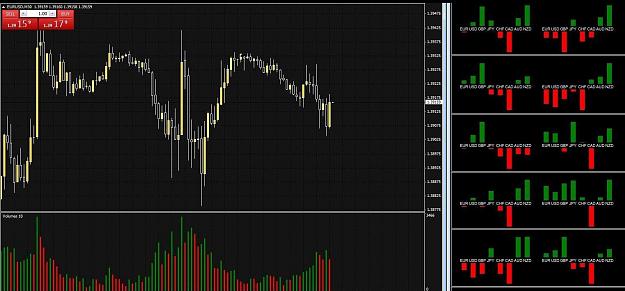
Hahaha, you don't have a clue what I am talking about. The reason why I don't use a chart is because i have all the information, that's happening on everytime frame all the time, and who is buying or selling, and which currencies move more freely. ...
How to correctly use Doji candlesticks to spot a reversal?
- saneblane replied Jun 14, 2014
Why are you spamming the guys thread Magix? You're just trolling the man's thread, he ask for a Doji, and you haven't said shit about it. that's a doji at the top of the market, it's basic common sense. This might be the third chart I posted here so ...
How to correctly use Doji candlesticks to spot a reversal?
- saneblane replied Jun 14, 2014
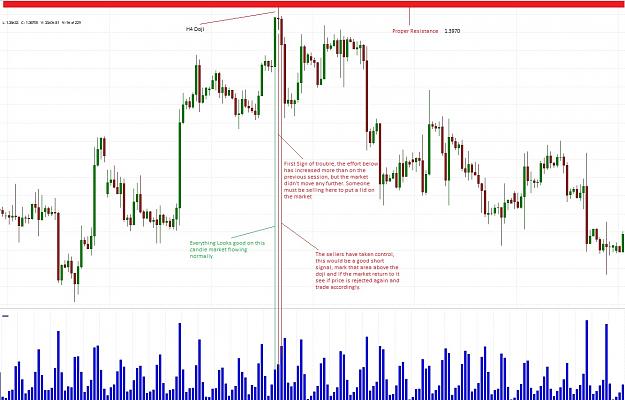
Getting back to the basis of this thread. This is what you look for OP, the Doji on the chart is an H4 doji, it is in the right spot, higher than anything else to the left and the market behaved according to the way a weak market should. The market ...
How to correctly use Doji candlesticks to spot a reversal?
- saneblane replied May 14, 2014
I just added a picture of my trade setup to give a better understanding of my tools, I am trying to get a new indicator made that would be more accurate at making calculation of the live market data than the one I have now. It's crude but this is ...
Order flow trading thread
- Posts by Member Search: 'saneblane'