- Search Energy EXCH
- 25 Results
- rjlacha replied Mar 12, 2011
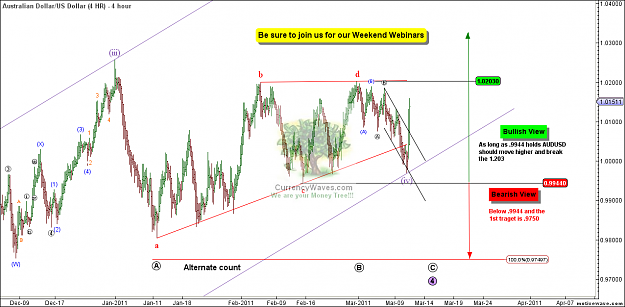
Nice plan!! looking for the 1.0203 to break as long as .9944 hold. Below that then we could see .9750 before the 1.0203 break to the upside.
AUD/USD
- rjlacha replied Mar 12, 2011
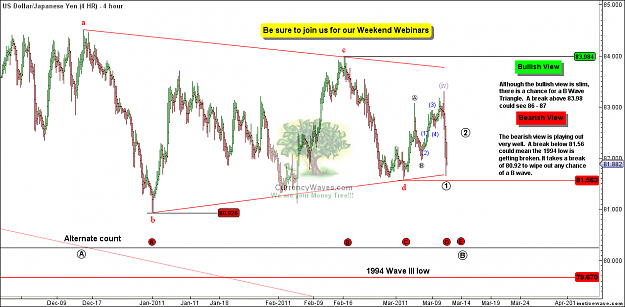
1994 low take out? — I am pretty sure that we will see the 1994 of 79.67 broken before any rally. On the bullish side, if 84.00 is taken out then we could see 86.00 to 87.00 before the 1994 lows are taken out.
USD/JPY Discussion
- rjlacha replied Mar 12, 2011
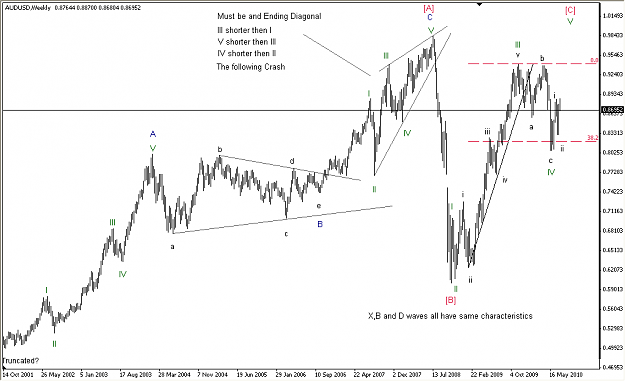
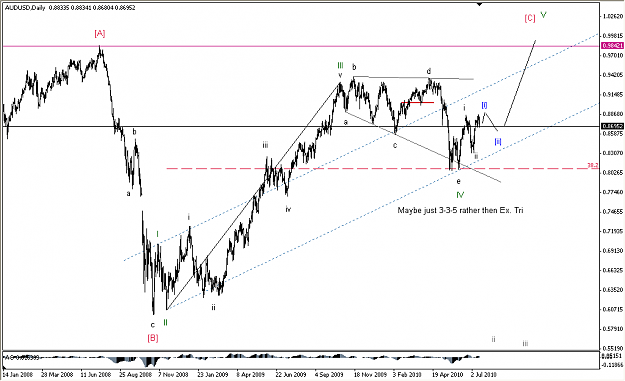
I believe the pull back was a correction or at least part of a correction. If you look at the first leg down of this correction the A wave does not channel well. I believe it is 3 down with expanded flat followed by 5 down for C.
Elliott Wave Trading

- rjlacha replied Mar 12, 2011
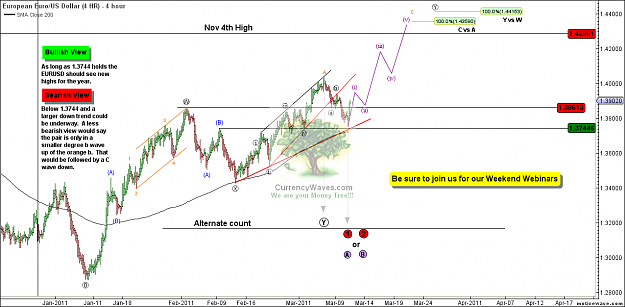
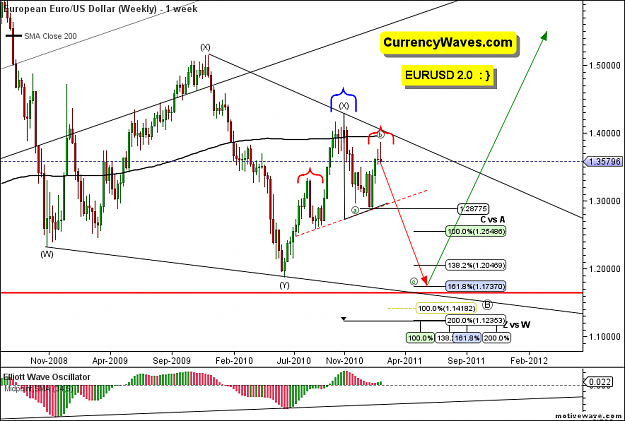
I believe as long as we hold 1.3744 we could see 1.44..Below 1.3744 and it could be a long ways down..
EURUSD
- rjlacha replied Feb 6, 2011
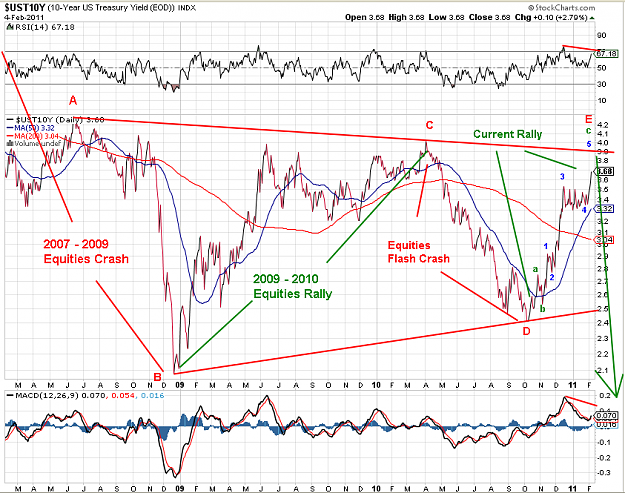
10 YR Treasury Yields... — The 10 YR Treasury Yields chart below is a huge factor in what happens with the Yen Crosses. Note that each time the 10 YR TR Yields topped so did the USDJPY and each time it maked new lows even if the 10 YR did not ...
USD/JPY Discussion
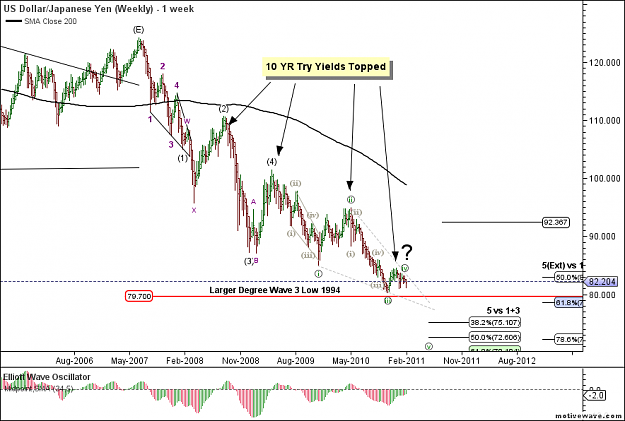
- rjlacha replied Feb 6, 2011
A couple a nice weekly bearish candles. Last weeks formed a nice 5 waves down on the 4 hr chart.
Elliott Wave Trading

- rjlacha replied Feb 6, 2011
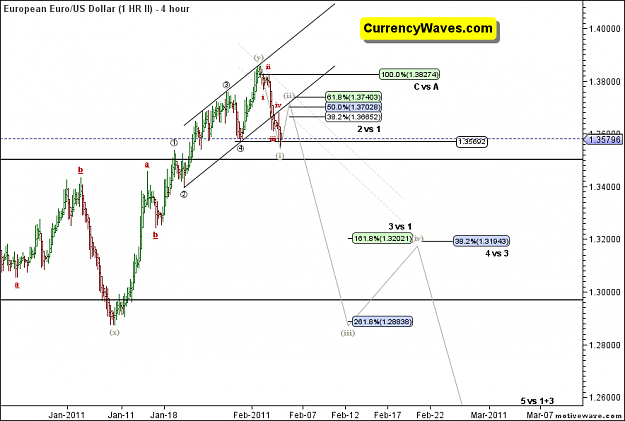
5 Waves down — A look at the 5 waves down on the 4 HR Chart. Should be a good short in the 1.3700 area.
EURUSD
- rjlacha replied Feb 6, 2011
EURUSD Weekly — A couple of nice bearish candles on the weekly. Last weeks bearish candle produced a very nice 5 waves down. Weekly image image
EURUSD

- rjlacha replied May 29, 2010
USDCHF Weekly Part II — I change the count on the Weekly chart and it looks much better.
Elliott Wave Trading
- rjlacha replied May 28, 2010
Watching the same count on the USDCAD.... Here are 3 charts of the USDCHF...5 MN, 1HR and a weekly.. First the hourly chart shows a nice Bull flag for a wave (iv) before the final wave up of wave 1 or C. The 5 Minute chart shows the current "X" Leg ...
Elliott Wave Trading
- rjlacha replied May 18, 2010
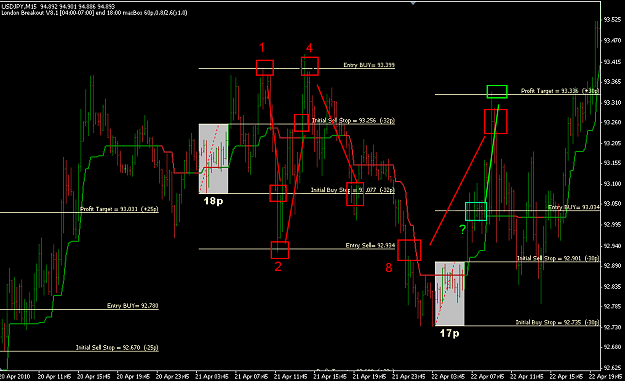
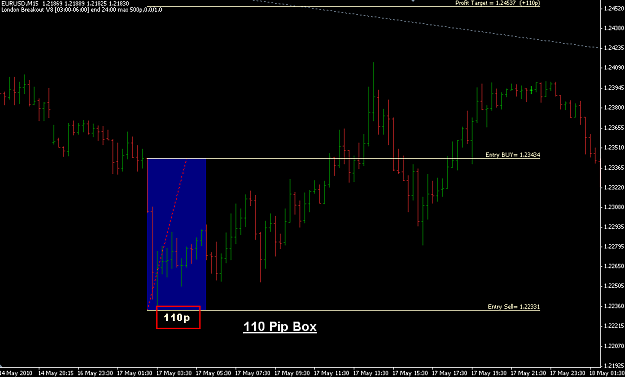
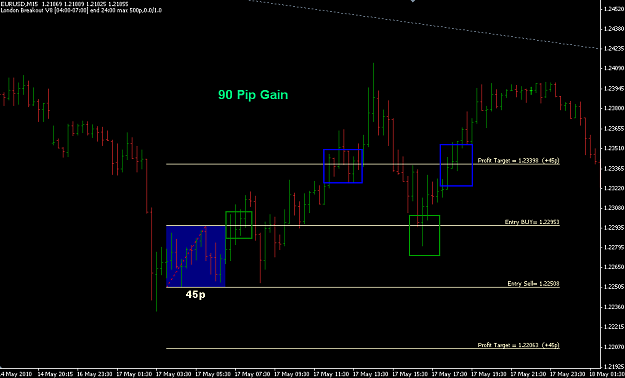
Hi I just wanted to show everybody something I do when we get a large box like this 110 pip box. Rather then trying to trade that size box with the big stops I move the box up 1 hour. So rather then have the indicator set for 3-6 GMT I set it for ...
London/US Range Trading
- rjlacha replied May 15, 2010
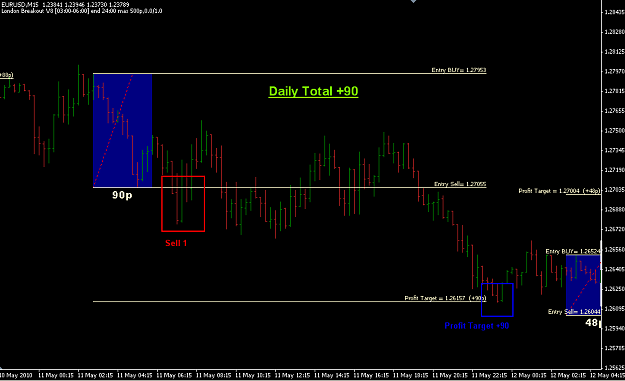
Here is a look at Tuesday 05/11/10. One trade for +90 Pips Total.
London/US Range Trading
- rjlacha replied May 15, 2010
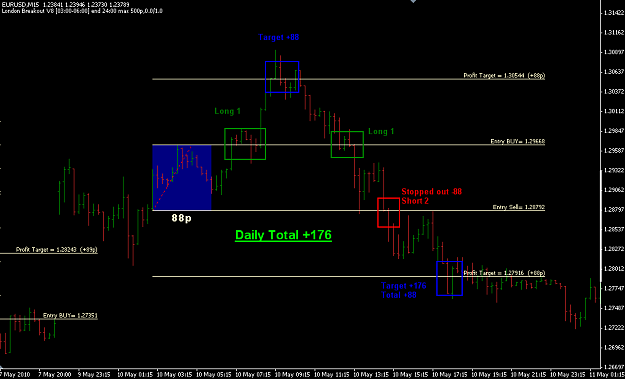
Here is a look at the EURUSD chart for Monday 05/10/10. 176 Pips Total for the day. Only had to double up once.
London/US Range Trading
- rjlacha replied May 14, 2010
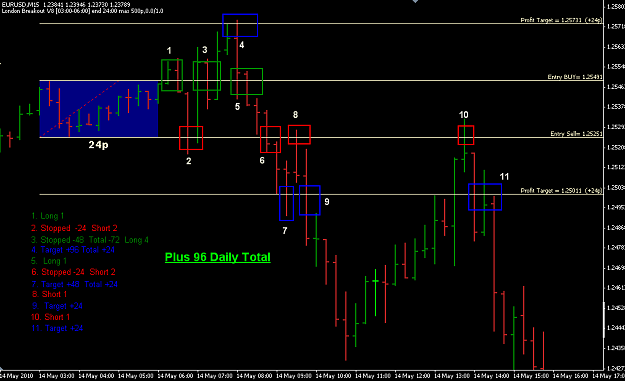
Nice day on the EUR/USD today. 96 Pips total and only had to double up a couple times. If you traded only until the first win then you would have been done on the 3rd trade. GBPUSD had a good day also..Will work on a chart for it later.
London/US Range Trading
- rjlacha replied May 13, 2010
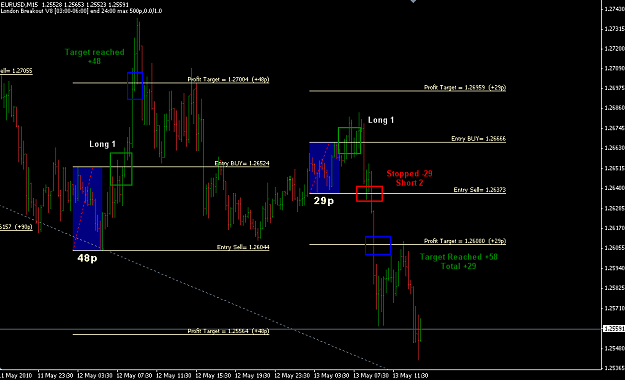
Results for May 12th and 13th May 12th we hit our target on the first try for a daily total of +48. May 13th we were stopped out of our first long and went short 2 lots and hit the target for a daily total of +29
London/US Range Trading
- rjlacha replied May 13, 2010
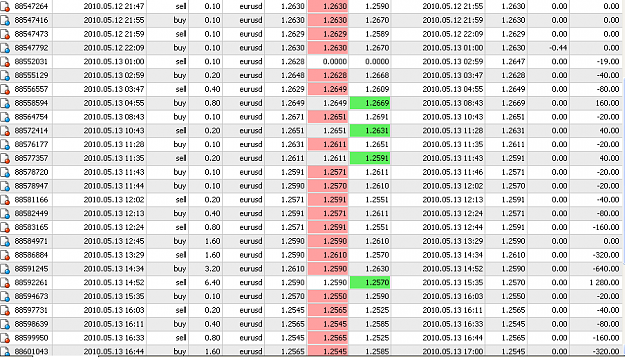
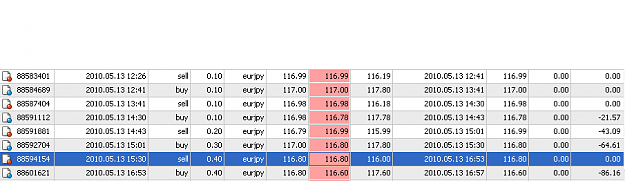
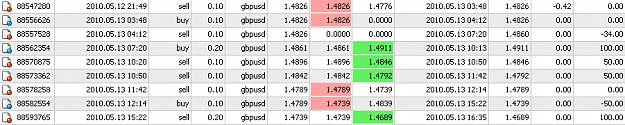
I am running this on 3 different pair with 3 different settings. EURUSD: TP 20 SL 20 BE 15 Martingale setting .1,.2,.4,.8,1.6,3.2...ect This one is killing my account at the moment. Will have to try something new on this pair. EURJPY: TP 40 SL 10 BE ...
Safe (PowerSM Modified) EA
- rjlacha replied May 12, 2010
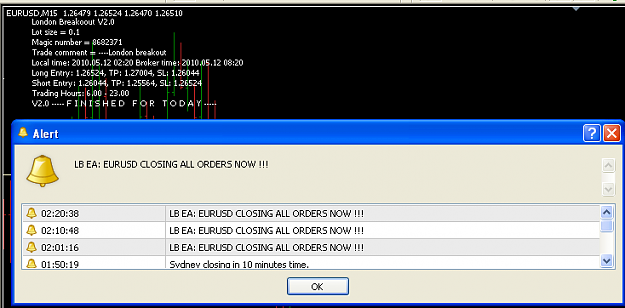
Nice work on all this Sq.... I checked mine for that error and it was fine but I keep getting this message shown in pic below.... Any Ideas???
A Simple London Breakout
- rjlacha replied May 5, 2010
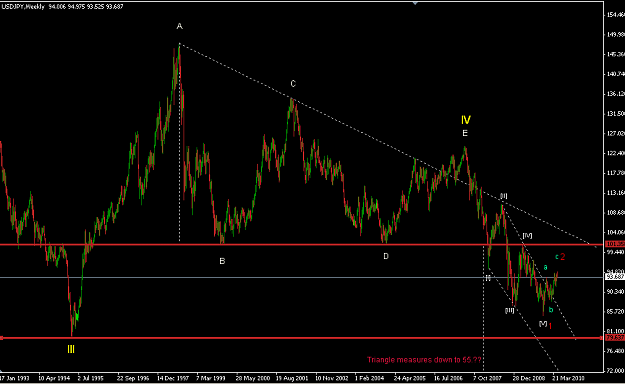
A weekly look at the USDJPY... The triangle measures down to 55.00 area if somebody was looking for a loooooong term trade on the pair. I would think that 101.35 is going to be pretty tough resistance if it gets that high....
USD/JPY Discussion
- rjlacha replied May 3, 2010
Hey Mer071898,,Great work!! I like the new settings and think we are on step closer to those drinks..
A Simple London Breakout I have a question on the Martingale and hold positions until the stop or target is hit. In the chart below of the USDJPY on April 21st we had a ...