- Search Energy EXCH
- 15 Results
-
 rexio replied Jul 4, 2013
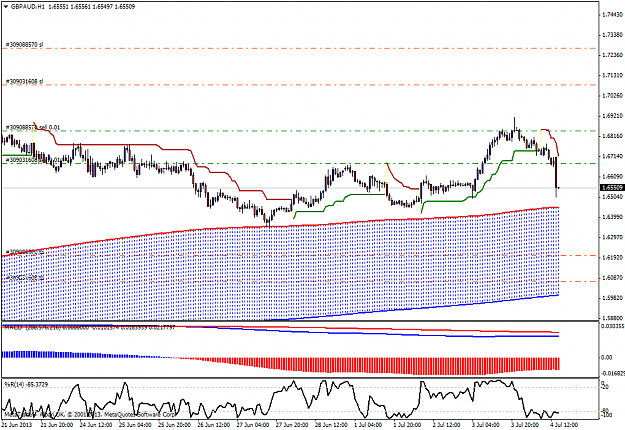
Hi S3, Could you surprise us with a chart with one or two examples on it. I suppose the timeframe would be 1 hour ? Thanks. I give it a try here myself. Here is an attached example of the H1 chart of currently GBPAUD. It is the template of TCO. This ...
TCO Trader EA
- rexio replied Jul 4, 2013
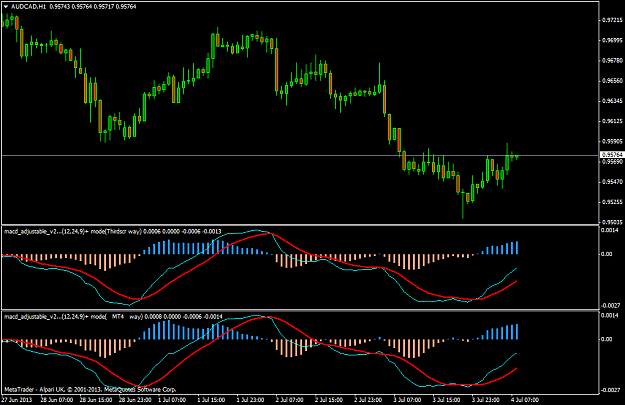
In the attached image I created the same 2 charts, but now both represented in the same way: mian versus signal line a) Thirdscreen way = macd_adjustable b) Official macd way of calculation Now you can see at once where the minor differences are.
TCO Trader EA
- rexio replied Jul 2, 2013
What is "EMA turtle" ? I understand that we use here the "Turtle" method. That applies to the highest high of the last 20 or so candles and the lowest low. But what has "EMA" to do with it ? Is that an exponentially fast moving turtle ?
TCO Trader EA

- rexio replied Jul 1, 2013
Perhaps I start :"NAKED TRADING".
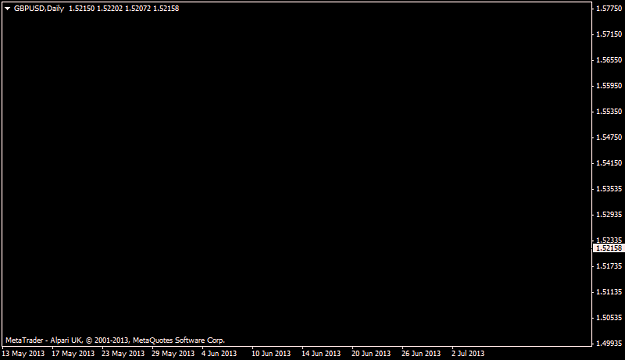
TCO Trader EA I don't want anything on my chart. No confusion at all ! ( See my chart of GBPUSD Daily timeframe).
- rexio replied Jul 1, 2013
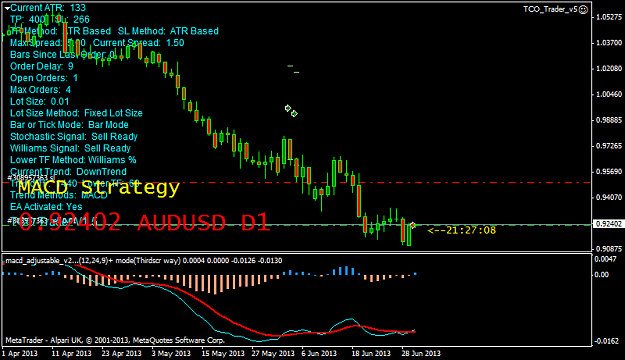
Question : Why does AUDUSD give a SELL at this moment ? Answer : If you have "CheckOncePerBar == true" , then the EA will only take the MACD value of the previous day. In this case that means : the previous day is minus. However, the current day at ...
TCO Trader EA
- rexio replied Jun 29, 2013
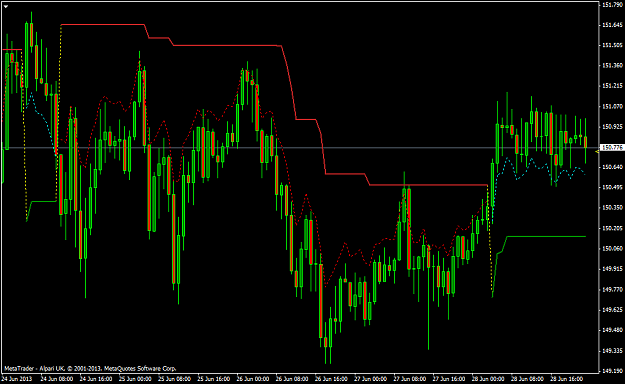
And here, especially for Claudia2, as she mentioned a possible breakout scenario in GBPJPY : The chart in H1. In theory, I would be in a long position at 150.56 right now with this method. The SL around 150.14 somewhere as this is the reversal area.
TCO Trader EA
- rexio replied Jun 29, 2013
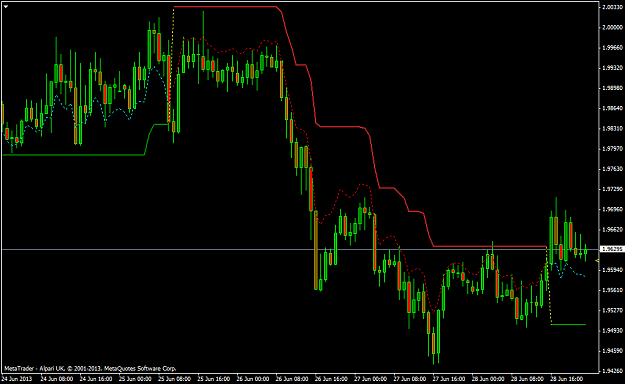
It was rainy here also. So there was time to create what I call "the entry line" . It looks like a compromise between S3signals and Erebus. The solid line in the chart is the xSupertrend indicator. The dashed line is the line, where I would like to ...
TCO Trader EA
- rexio replied Jun 28, 2013
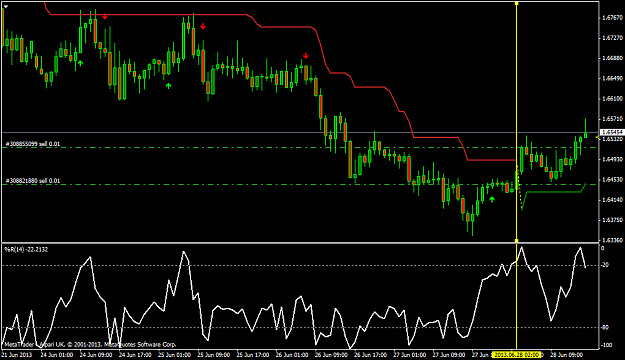
Could you post a chart to show where you would avoid trades and where you would take a trade ? Thanks. Here is my chart of gbpaud H1 at this moment together with your indicator.
TCO Trader EA
- rexio replied Jun 19, 2013
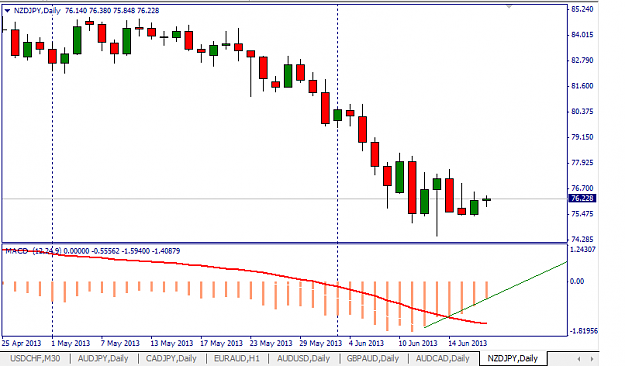
Hallo Mr. 100Pip, Here is my explanation why I think that D1 Macd in NZDJPY will still be red tomorrow. Look at the attached image. That is the NZDJPY up untill now. Daily timeframe. As you can see, I drew a green regression line through the last 6 ...
Third Screen Strategy - Dr. Alexander Elder
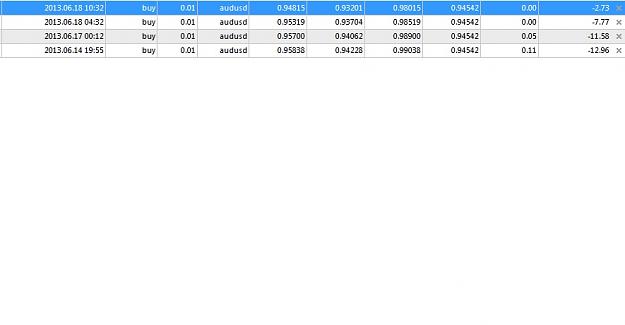
- rexio replied Jun 18, 2013
Hi MKF, I have 4 buys now for audusd, done with the regular EA :
Third Screen Strategy - Dr. Alexander Elder
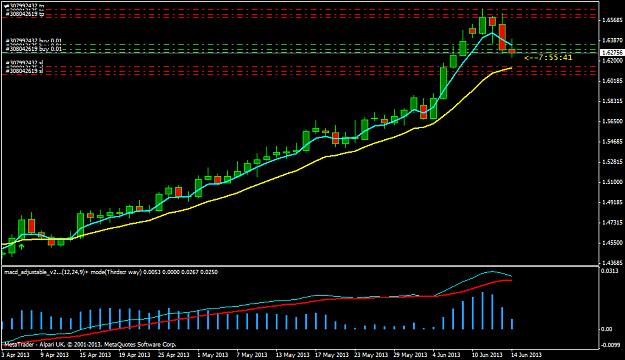
- rexio replied Jun 14, 2013
Hi MKF, Maybe those stochs are a good idea. Could you give us a screenshot. Also, in connection with the question of whether GBPAUD is in the blue or in the red at the moment on the macd daily. On my daily charts, GBPAUD still has an upward trend ...
Third Screen Strategy - Dr. Alexander Elder
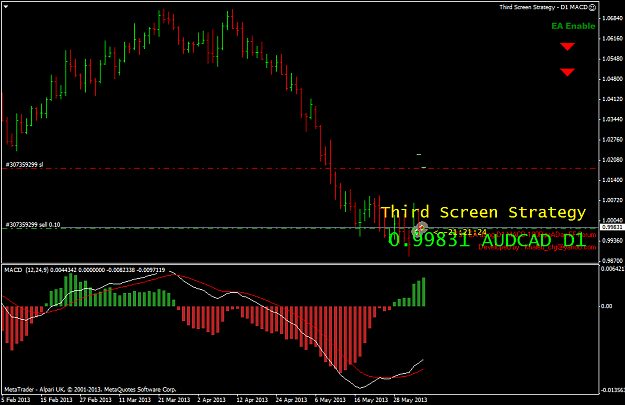
- rexio replied Jun 4, 2013
probably there is something wrong here. The triangle for the direction of the macd D1 is down and red, whereas the macd_ajustable is positve and green. Also, the EA makes a sell. This is not good. The daily macd is UP, so the EA should seek for ...
Third Screen Strategy - Dr. Alexander Elder
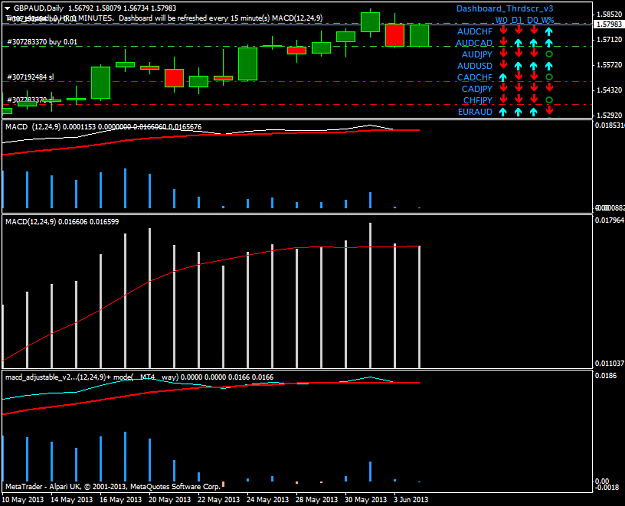
- rexio replied Jun 4, 2013
As you all know there were some issues with the Dashboard program in comparing its macd value with the value of macd_adjustable. Before starting this discussion, I want to give a few definitions. This ensures we all talk about the same subject. The ...
Third Screen Strategy - Dr. Alexander Elder
- rexio replied May 28, 2013
OK, I give you 1 spoon, but no more.
Third Screen Strategy - Dr. Alexander Elder

- rexio replied May 26, 2013
Trial to upload a picture. Ok, here we are but it was done in a complicated way. Maybe there is an easy way of doing this ? You see the dashboard attached to a daily chart of the USDJPY. In the chart we see the usual indicators, like the ...
Third Screen Strategy - Dr. Alexander Elder
- Posts by Member Search: 'rexio'