- Search Energy EXCH
- 21 Results
-
 realfan replied Jun 22, 2017
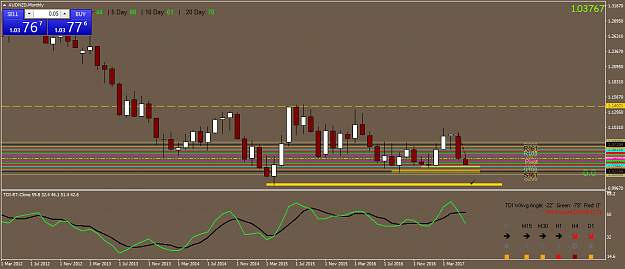
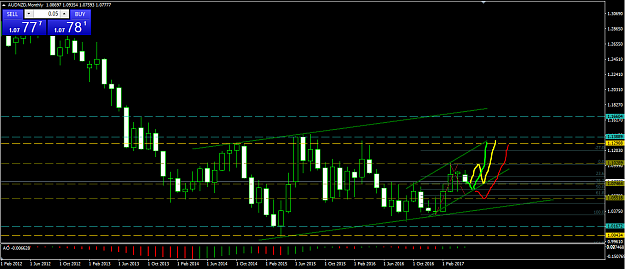
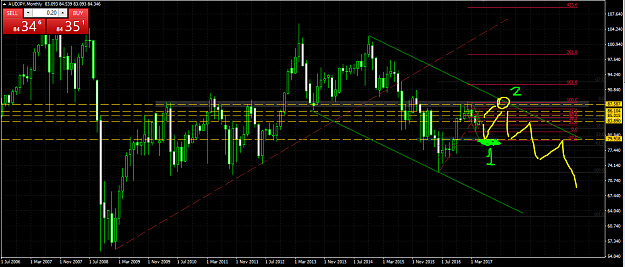
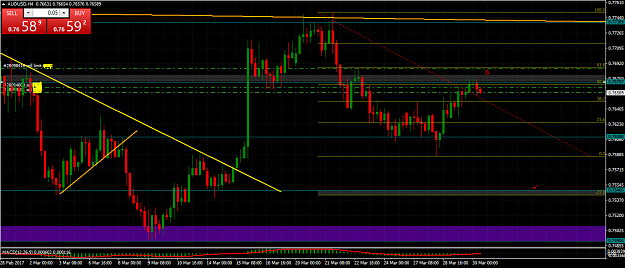
I am looking at AN Monthly chart and i see that we might go all the way to the low at parity. I was long building my positions but exited at around 1.0470 as it looked like we were in a corrective structure and heading down again. I think next week ...
Pivot Trading
- realfan replied Jun 15, 2017
I think that is going to be a great trade. Have to climb some more for now though.
Pivot Trading
- realfan replied Jun 7, 2017
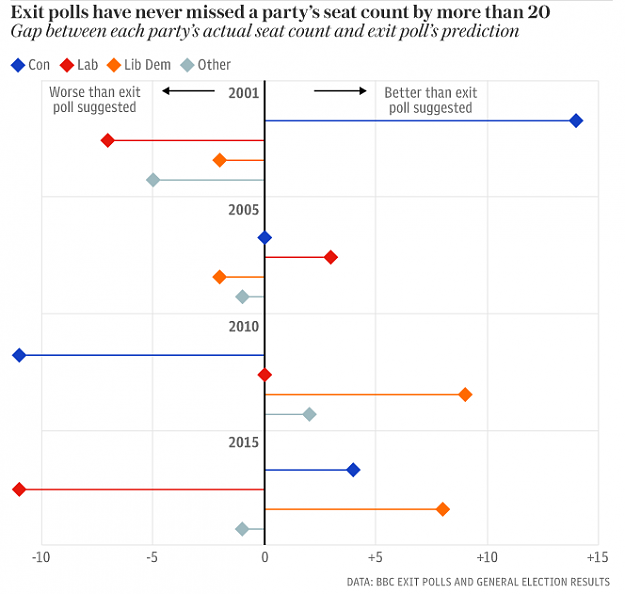
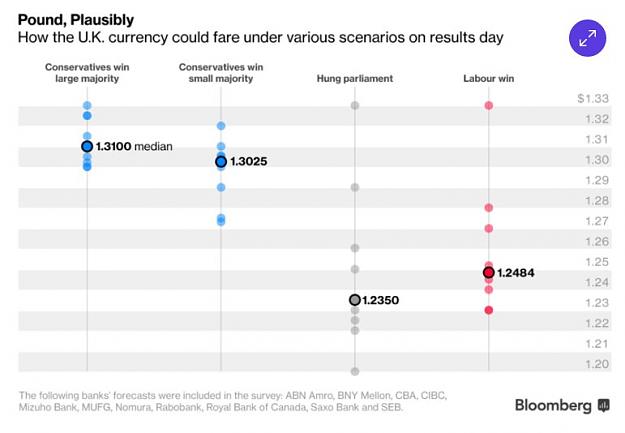
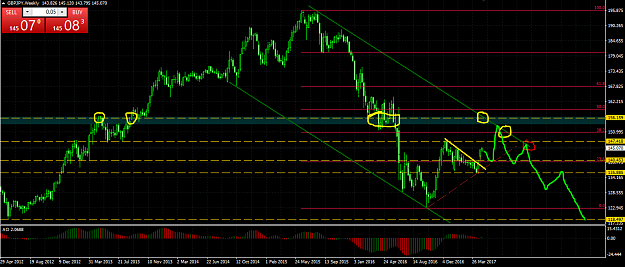
TA looks very bearish to me. The question is how high can it go from here until it reverses. We`ve got a slow zig-zag move from 1.2770 to 1.2960 (current price) which i think might be the result of the market pricing in a more probable Conservative ...
The Really Useless Thread
- realfan replied May 31, 2017
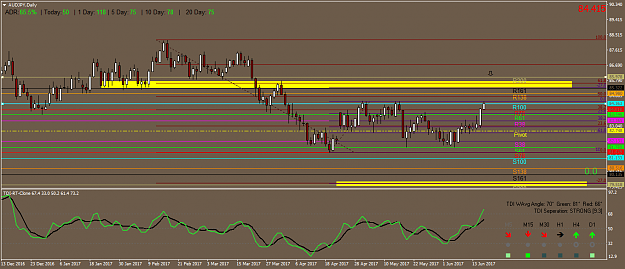
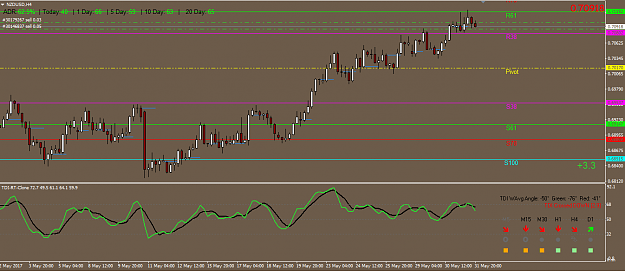
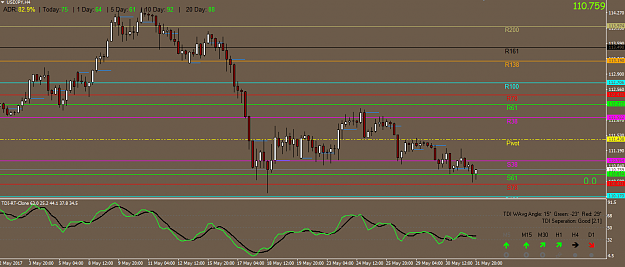
Nice bounce of R61 on NU. UJ is turning bulish. Target at R100 and R138. All the USD pairs look like turning. Do you think we will have a decent run in USD until Fed?
Pivot Trading
- realfan replied May 25, 2017
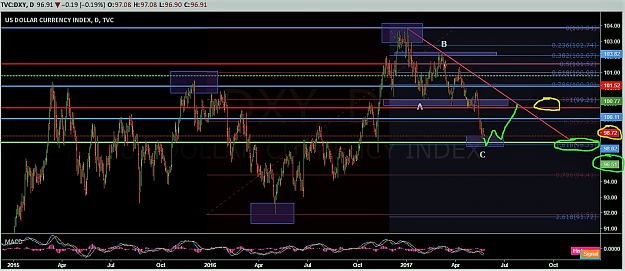
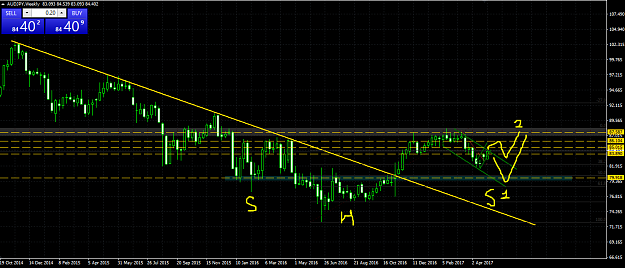
What do you think about the 96.5? Its the 61.8% Fib retracement of the previous impulse up (92 > 104), the 1.618% extension of the AB wave (u can see it on the chart) and also seems like a very decent support/resistance for the past couple years. I ...
The Really Useless Thread
- realfan replied May 21, 2017
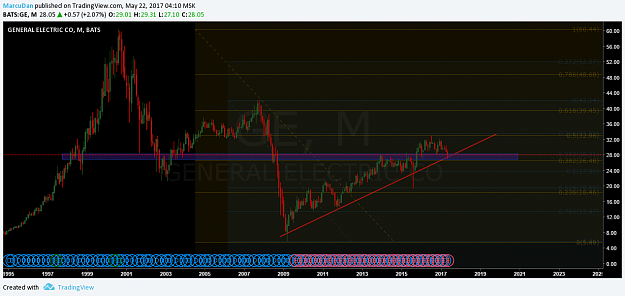
GE seems to be in a decisive area LT. I think that if you want to buy it, it should be bought around these levels. In my terms it completed a full retrace on Weekly and Daily charts, and it stopped at a really strong support. Monthly close should ...
The Really Useless Thread
- realfan replied May 18, 2017
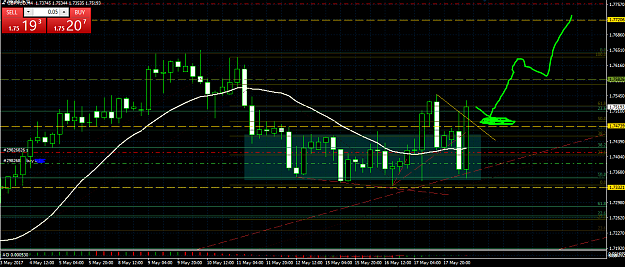
Not a big dip but still buying. GA has a lot of room to the upside.
Cable Update (GBPUSD)
- realfan replied May 18, 2017
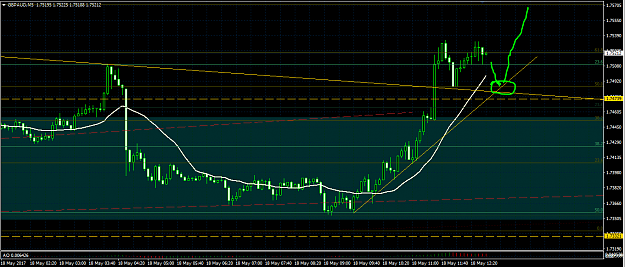
Bought some GA. Target 1.78. Will add at the pullback
Cable Update (GBPUSD)
- realfan replied May 11, 2017
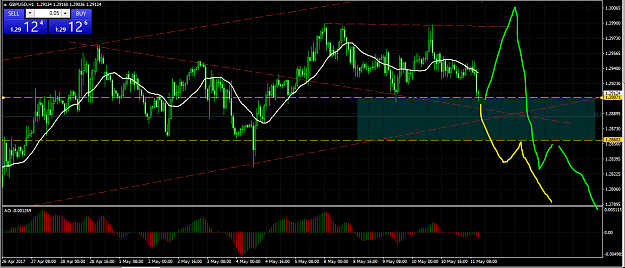
Based on the structure, the upside may be limited.
Cable Update (GBPUSD)
- realfan replied May 10, 2017
I know we are stepping into dark times and have to watch everything thats been going on very clossely, but i am still surprises nobody mentioned the Europe Day (Council of Europe on 5th and EU on 9th). May we all live in peace and make pips.
The Really Useless Thread
- realfan replied May 4, 2017
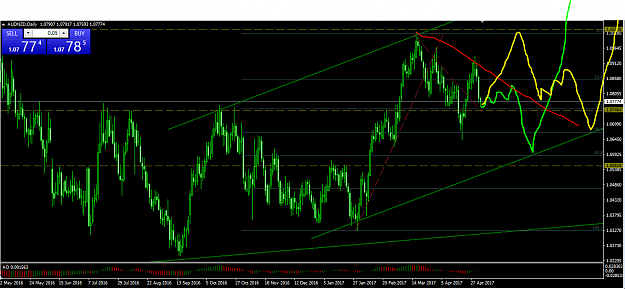
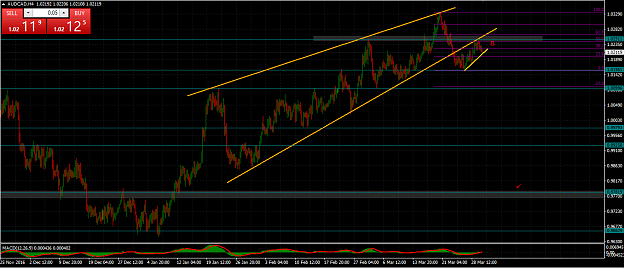
Aud/Nzd long term looks bullish to me all the way towards 1.14xx/16xx. We might go up from current levels 1.07/08 or i see a chance of correcting further more 1.05xx-1.06xx but no more than that.
AUD/USD
- realfan replied May 3, 2017
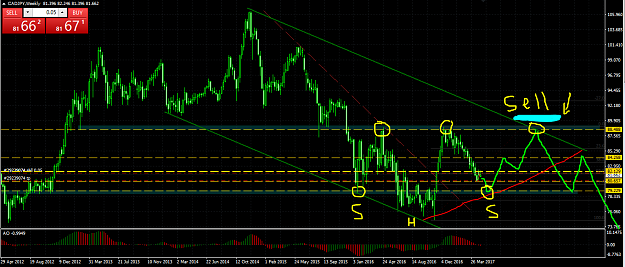
All the yen pairs look to have a similar structure. Long term (Weekly chart) we are in a JPY uptrend, in a corrective move. I think we are going to get a stronger Yen at the end of 2017. Mid-term Yen should weaken and finish the C wave of the ABC ...
Dragon Riders GBP/JPY
- realfan replied May 1, 2017
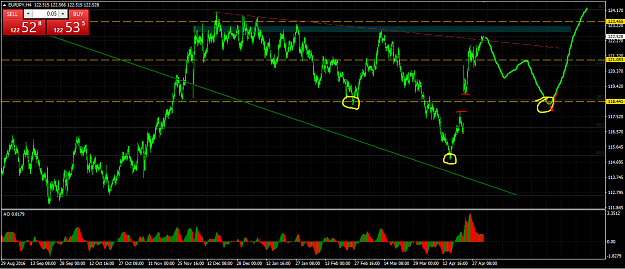
We are definitely in a decisive area right now. 1.097x-1.1050 is a resistance very hard to crack. By the way structure is forming and FA wise i dont see many reasons for it to be broken in the upcoming weeks. I would rather expect a bounce towards ...
The Really Useless Thread
- realfan replied Apr 12, 2017
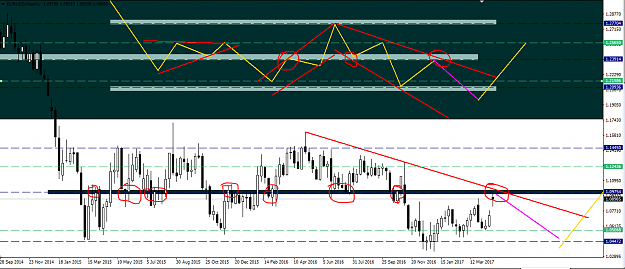
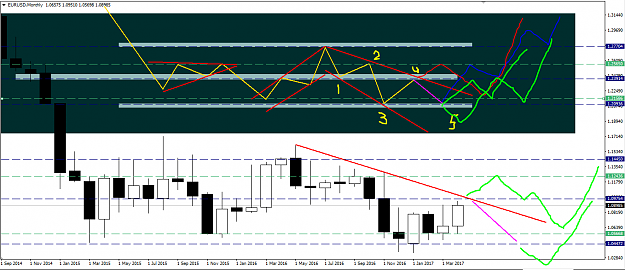
I'm sorry for my sloppy TA, but i think the graph is showing the same as some of you guys are discussing here, (Euro strength from Q3-4). So, i think we might easy get to see parity in quick and short lived move and then looking for the LT bottom. ...
The Really Useless Thread
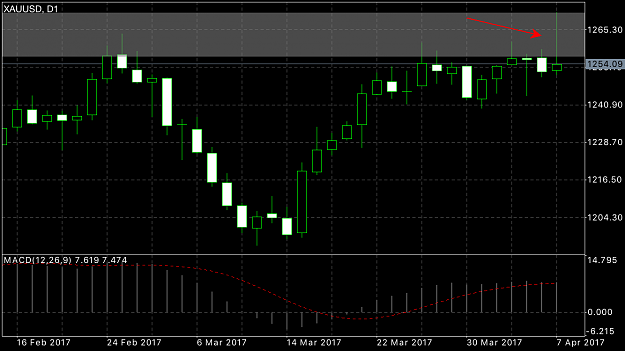
- realfan replied Mar 30, 2017
A big chance we will have another correction down on gold.
XAU/USD & XAG/USD - Gold & Silver Traders Thread
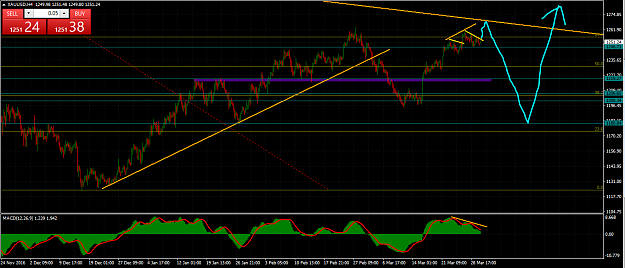
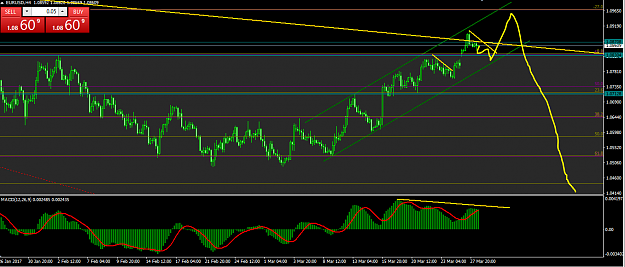
- realfan replied Mar 28, 2017
Big boys loading shorts on the way up. I think we are almost there. Probably will have another high at about 1.0950-70 and then short as much as i can get.
EURUSD