- Search Energy EXCH
- 14 Results
- ravs_avs replied Dec 4, 2018
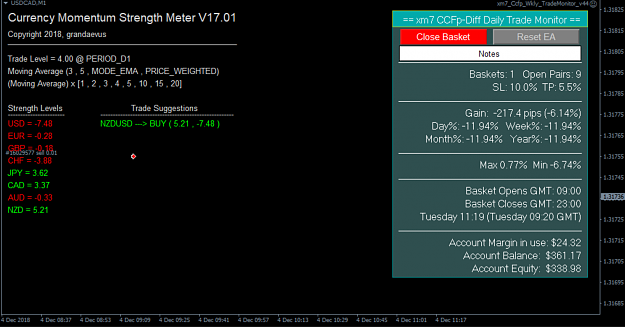
It is getting worse with each passing minute??? image
CCFp weekly signals (set and forget basket trading)
- ravs_avs replied Dec 4, 2018
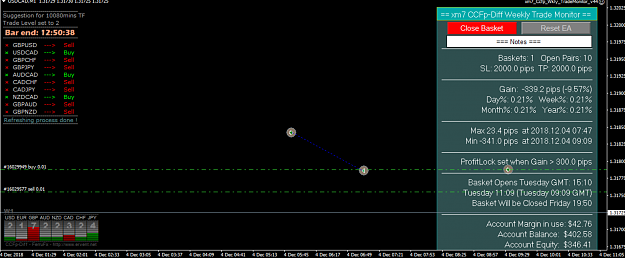
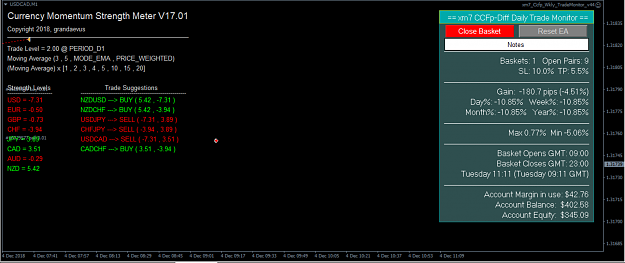
I am not sure what am I doing wrong but these are the results on my live account and using Yohec settings- image And this is the screenshot using drfx settings - image Both are in heavy drawdown
CCFp weekly signals (set and forget basket trading)
- ravs_avs replied Dec 9, 2016
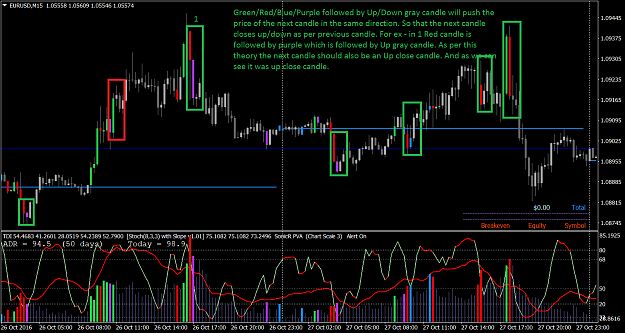
Hi Kleybenny, Please find an image explaining this below. Volume should always be taken as a supporting evidence to a main strategy. The reason behind my first point "Get SonicRPVACandle indi. Look for colored candles(red or green) and the ...
Jewels of knowledge
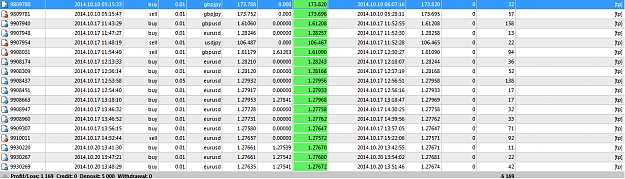
- ravs_avs replied Oct 20, 2014
Hi guys, Just want to share my results. I don't think it is perfect yet but I think what I have found is quiet promising. Thanks to everyone who is a part of this thread. You all have helped with open hearts. I feel gratitude towards EURUSDD for ...
The similarity system
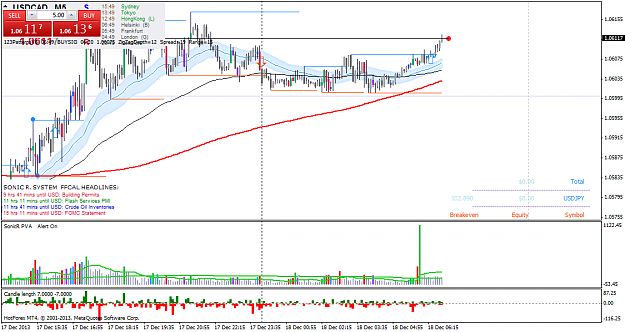
- ravs_avs replied Dec 18, 2013
I am not sure whats going on with UC. There has been an ultra high volume bar on 5 minutes with very low range. After this bar the price has gone up on low volume. This does mean that there was a lot of activity during those 5 minutes. Background ...
Sonic R. System
- ravs_avs replied Nov 22, 2013
Hi Loeil, How come I have different candle color then yours for GU on H1??
Sonic R. System
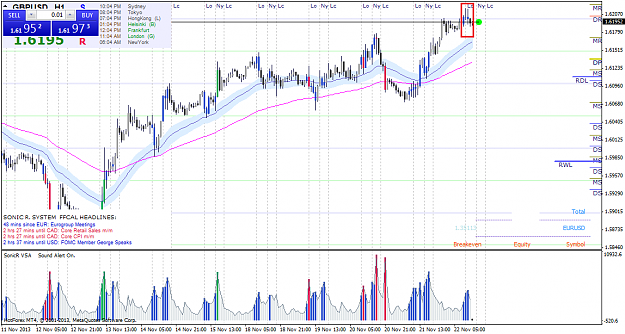
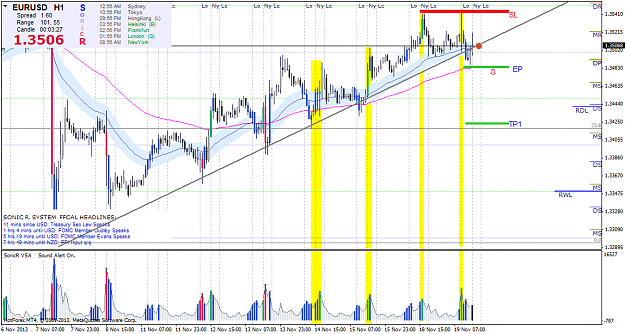
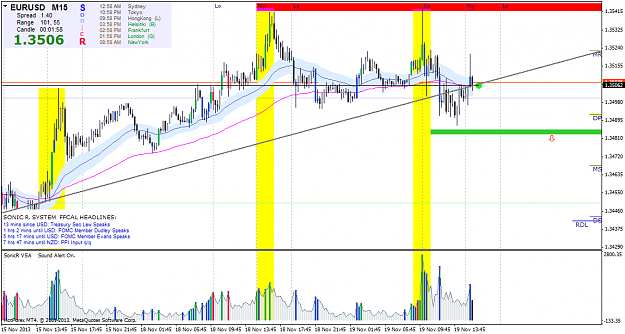
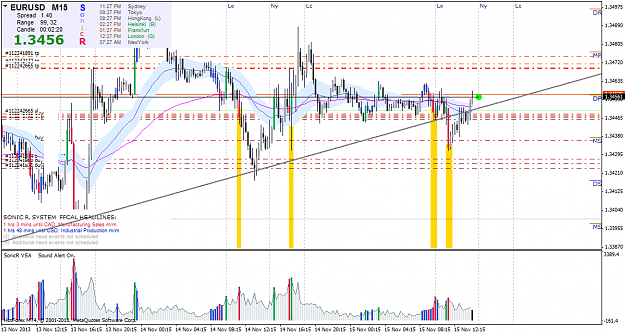
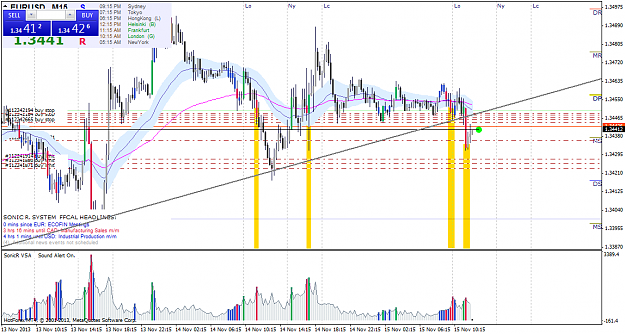
- ravs_avs replied Nov 19, 2013
Hi, I have short bias for EURUSD and my reasoning is below in the screenshots. Any comments are appreciated. H1 I can see bears in the background image M15 again bears on the tops image
Sonic R. System
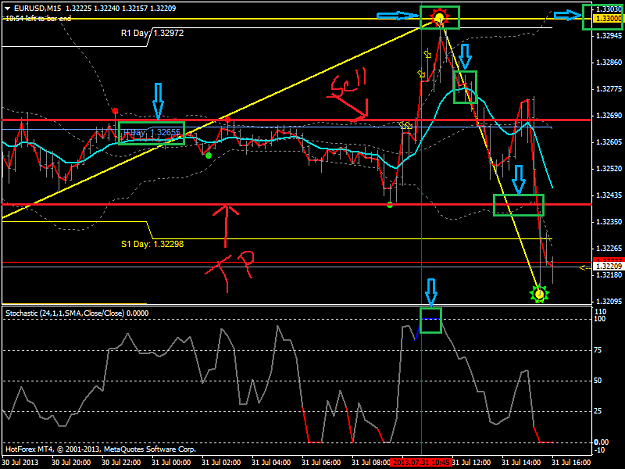
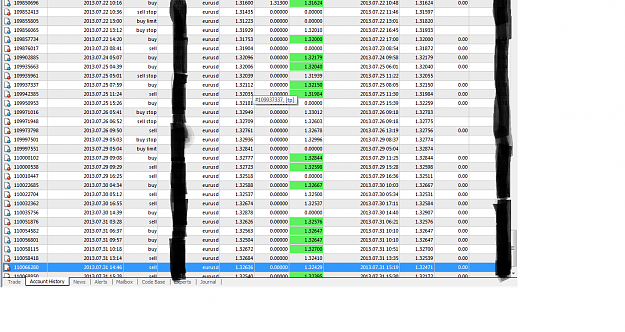
- ravs_avs replied Jul 31, 2013
Hi, The stoch-bb method for me has been the best. I have been using it since last week, though still needs to be tested more. i have taken 23 trades with 100% success rate. 23 profits with no losses. my stop losses are much further away and if a ...
Similarity: A Practical Approach
- ravs_avs replied Jun 10, 2013
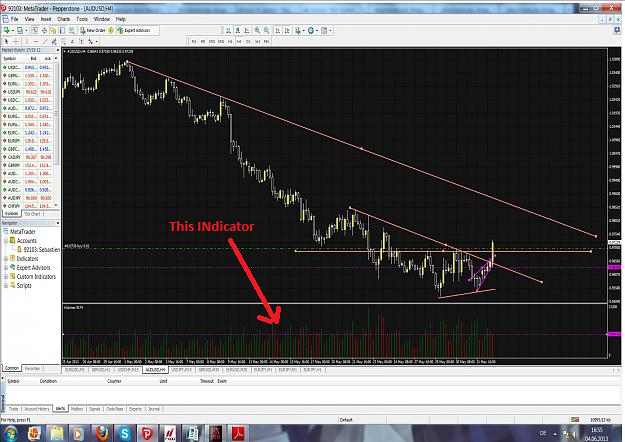
Hi ChanhXanh, If the line drawn in the volume indicator a dynamic line or a static line? Thanks. Rav
Extreme TMA System
- ravs_avs replied Jun 3, 2013
Thanks for the reply Bass, really appreciate it!! I absolutely agree with you, the daily time frame is truly an excellent way to validate signals. GBPUSD is near the daily lower TMA band. This implies the possibility of price to reverse back in ...
Extreme TMA System
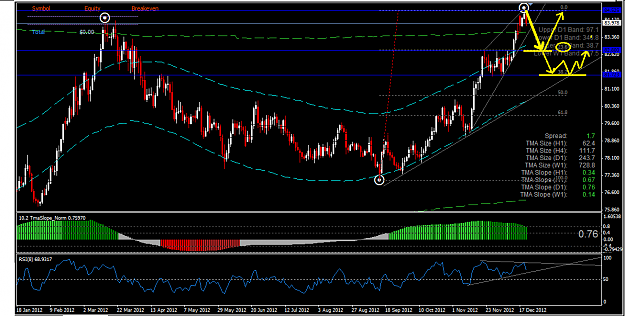
- ravs_avs replied Dec 20, 2012
Hi Cold_W, I agree with your thoughts, as TMA analysis suggests the pair is in need of a reversal/consolidation. Also it is at daily resistance level. And there is bearish RSI divergence on daily. I would say that it has a 90% chance of going ...
Extreme TMA System
- Posts by Member Search: 'ravs_avs'