- Search Energy EXCH
- 49 Results (2 Threads , 47 Replies )
-
 rainingpips replied Jul 18, 2018
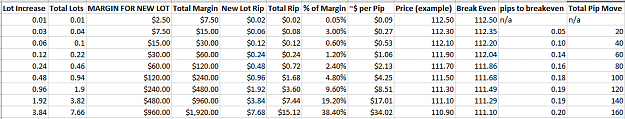
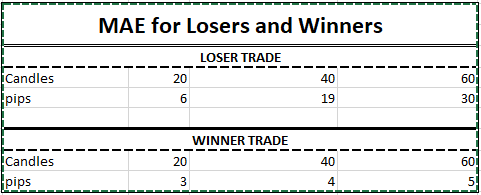
Can you explain what the columns represent in the chart you posted? Below is the chart that I follow for the current system: image
The Killing Floor
- rainingpips replied Jul 15, 2018
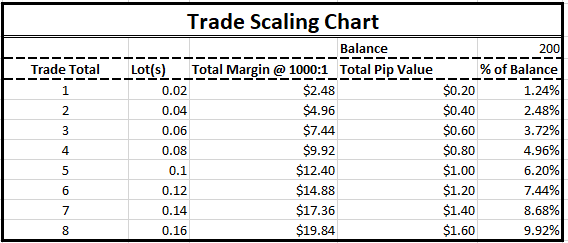
Win rate doesn't matter as much as probability of profit. The way to control that is through scaling into a trade and cutting a loser. For the majority of my trades (the current TE trades isn't the best reference for this, as I was playing around ...
The Killing Floor
- rainingpips replied Jul 10, 2018
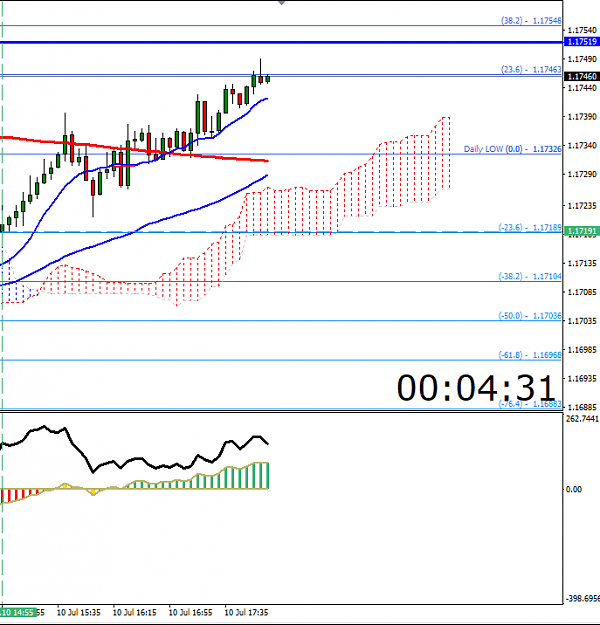
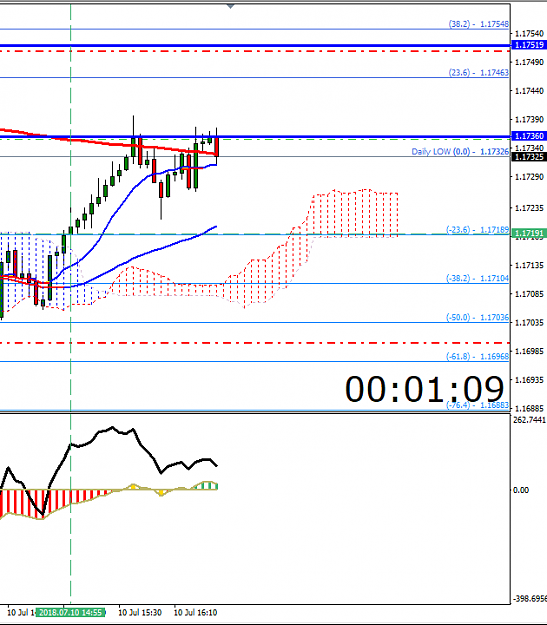
PA hit the 23.6 Fibo line. Here's where I'm not 100% sure what to do. My TPs were hit for a nice 9.3/9.6 pip profit for both 2.5 lot orders. Would appreciate any input, especially from Sys image
The Killing Floor
- rainingpips replied Jul 10, 2018
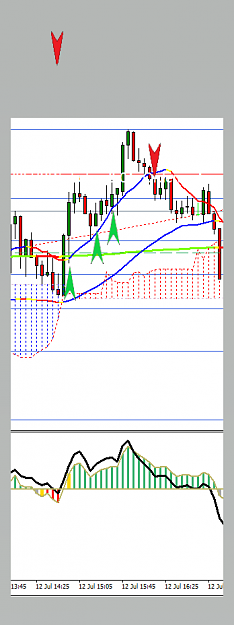
Scaling in on a EURUSD buy here image Price popped above the 200 EMA and then dropped down a bit, then popped above again. Entered on subsequent bars after PA closed above the 200 EMA. In right now for two separate orders of 2.5 lots each.
The Killing Floor
- rainingpips replied Jul 8, 2018
I appreciate the amount of statistical analysis Sis.yphusis completed for the various system events, and have to give it a try. My only problem is the lack of specific MM or trade management principles/guidelines applied to his statistics. In his ...
The Killing Floor
- rainingpips replied Feb 25, 2010
Looks like your broker is quoting to 5 digits. Mine quotes only to 4. I'm not sure how much this would change the scheme of things however. Your trade is only 2.x pips down; as I initially thought it was 2x pips down. I eyeballed it, and yours is ...
CoG + Ultra Trend System
- rainingpips replied Feb 25, 2010
There is a possible SDL(100) change about to occur. Notice how PA and the HMA(10) are nudging up closer to the SDL(100). PA is at support as well, expecting a long.
CoG + Ultra Trend System
- rainingpips replied Feb 24, 2010
Quick little update on those interested in the new system. The last SDL(100) trend change downward is now good for around 150 pips. You of course would have the option of exiting and re-entering on the HMA(10) pullbacks, but from the very inception ...
CoG + Ultra Trend System
- rainingpips replied Feb 24, 2010
Here's a taste of what I'm working with now with Renko. Basically we have carry-over indicators like the Trix and SDL lines, but I've updated them with new parameters to work well with the Renko(5) offline streaming charts. The SDL(100) is what I'm ...
CoG + Ultra Trend System
- rainingpips replied Feb 15, 2010
Here's another signal on EURJPY, this time a long trade. Notice how the Renko "candles" were consistently hitting resistance/support (resistance for the Renko trend) @ 122.40. Renko blocks only form when the 5 pip "block" either above or below the ...
CoG + Ultra Trend System
- rainingpips replied Feb 15, 2010
Attached is a chart with a EURJPY short signal. Circled are the indications that the trend had changed, and approximately where to go short (around third green renko or first red renko following third green). Good for about 25 pips at the moment, if ...
CoG + Ultra Trend System
- rainingpips replied Feb 10, 2010
Here's a EURJPY chart I just got a long signal from. Notice how the the confirming Renko candle for the trend was accompanied by a buy sigal arrow. The UTF saw trouble penetrating past the "23" level on the previous downtrend. I've seen consistent ...
CoG + Ultra Trend System
- rainingpips replied Feb 10, 2010
Here's another chart of EURJPY with a developing short trade signal. Notice that the UTF has plateaued, the HMA(20) and Renko has demonstrated weakness and PA is a relatively far north, 25 pips away, from the MA(68). The last legitimate downtrend ...
CoG + Ultra Trend System
- rainingpips replied Feb 10, 2010
Here's an annotated chart that I traded off earlier today if EURJPY (a very good pair to use with this syste m despite the 3-4 pips spread from Interbank FX
CoG + Ultra Trend System ). The first trade was a short signal 1. The UT_FAST had plateaued (best possible prior ...
- rainingpips replied Feb 9, 2010
Here are two charts with the new indicators and template. Renko candles are somewhat independent of time, and work more so on patterns and price velocity (as far as I know). Everything else in the system is essentially the same, but the focus is now ...
CoG + Ultra Trend System
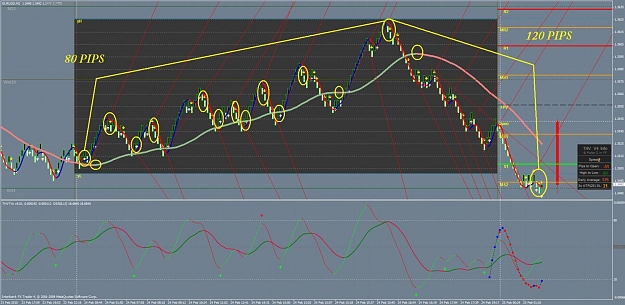
- rainingpips replied Feb 8, 2010
Here's the trade that I setup last night in my previous post. EURUSD was showing clear signs of a trend reversal, with the UTF showing movement to the upside, and the RSB beginning to diverge, and fan upward. If you got in around the open of the ...
CoG + Ultra Trend System
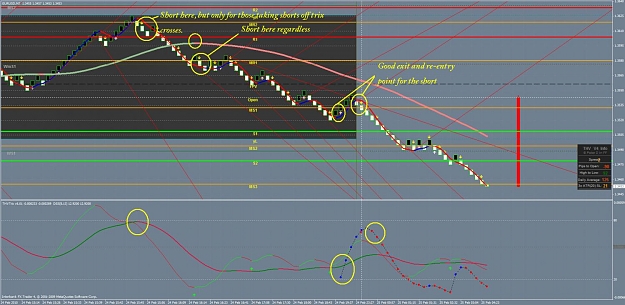
- rainingpips replied Feb 8, 2010
Attached is a EURUSD chart with, perhaps, the perfect setup to a very profitable, 300+ pips at the moment, short trade. I've circled the alerts in each window of the chart that indicate a short signal. Followers of the UT_FAST crossing ONLY should ...
CoG + Ultra Trend System
- rainingpips replied Jan 18, 2010
Here's my GBPUSD trade from this morning, up approx. 100 pips (about 96 with the spread). UT_FAST has plateaued, so we are looking to get out of this trade, with the trend reversing. Normally, once UT_FAST has surpassed the 15.5 "median" level it ...
CoG + Ultra Trend System
- rainingpips replied Jan 18, 2010
Here's a current chart of GBPUSD from tonight that I traded from. Notice how UT_FAST began on a positive slope from a plateau below the "4" level, after there was a confirmation cross in the MACD, with bars moving to topside. Then the Slope ...
CoG + Ultra Trend System
- rainingpips replied Jan 17, 2010
Wow this is fantastic! My expert programming skills are virtually ziltch unfortunately, hopefully I will be able to cope by the end of this year. One thing about the current expert. Since having originally posted this system, I use the CoG more as a ...
CoG + Ultra Trend System