- Search Energy EXCH
- 17 Results
-
 ptyforex replied Mar 30, 2015
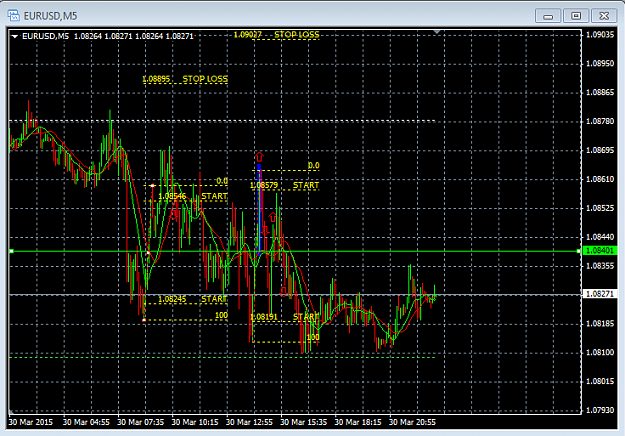
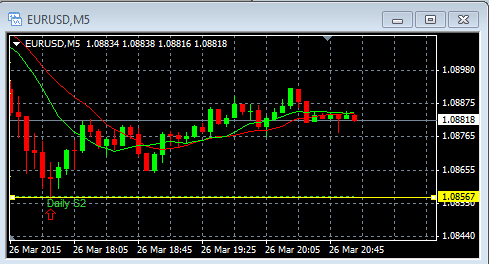
The green line is the price in which EU should be bought once the bid closes across it.... That price is valid UNLESS the S1 pivot is touched. image
EURUSD
- ptyforex replied Mar 30, 2015
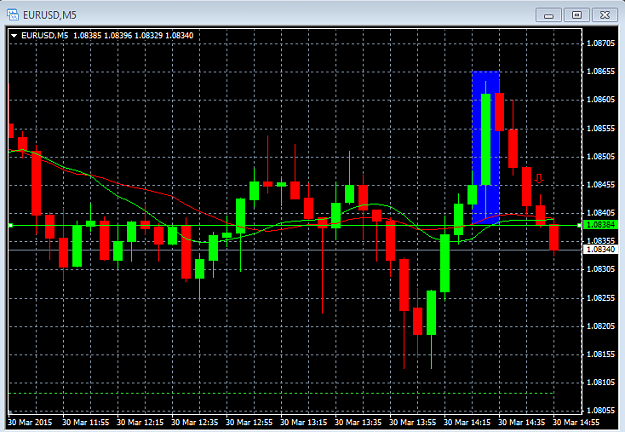
image Here the long resulted in a sl.. Yet for the .5% per pip position you took a loss of 3 pips. so 1.5% loss on that trade.
EURUSD
- ptyforex replied Mar 30, 2015
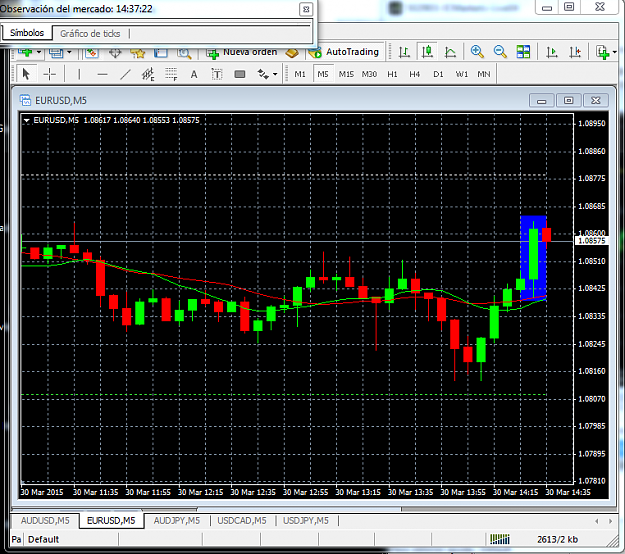
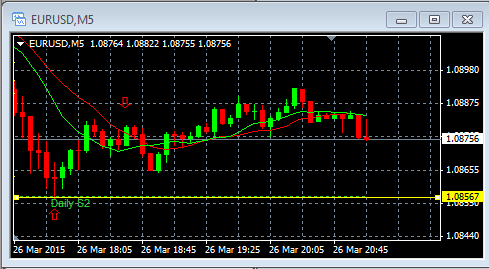
image Now you can see that the highlighted green candle has closed across the price (green line) which I gave in the last post. Now the low of the highlighted green candle is the sl (only if the bid closes under it 1.08369)
EURUSD
- ptyforex replied Mar 30, 2015
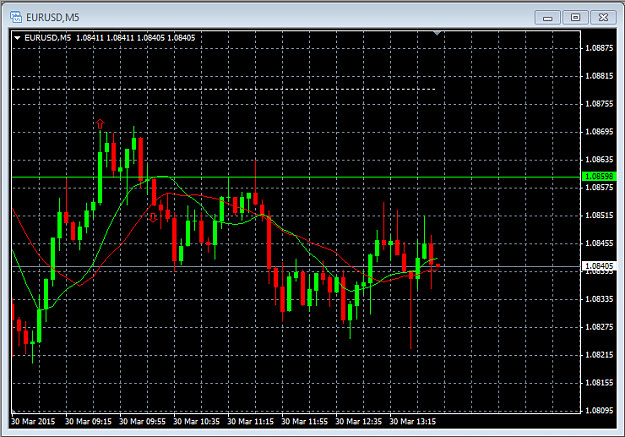
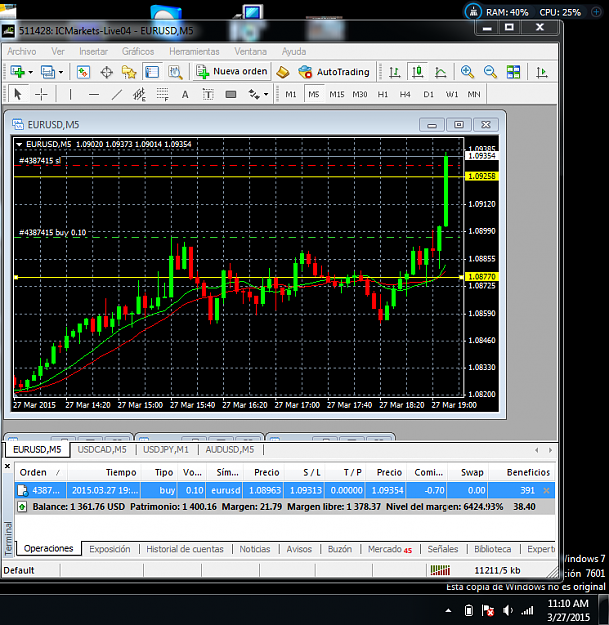
Good day to all. I have a scalping recommendation for those interested in following it. image At this current moment EU is under the 1.08598 buy line on the 5m chart. I would recommend BUYING EU once the bid closes across the price of 1.08598 on ...
EURUSD
- ptyforex replied Mar 27, 2015
Not to long ago I asked 21 vs 7 about EUR/USD and AUD/USD no longer correlating as of the last few hours. Since then (After the rumor news) you can now see that EUR/USD and AUD/USD are correlating once again. image How so? Simply look at the ...
EURUSD

- ptyforex replied Mar 27, 2015
EU touches Main pivot once again, but fails to close across it on the 5m chart... Big time sellers there. Not to mention we have a intraday cup and handle.... If EU moves one more pivot level up before Yellen speaks, I think we should all call it a ...
EURUSD

- ptyforex replied Mar 27, 2015
image You can now see the entry, and the take profit has been hit.
EURUSD To bad I was only wagering 1 usd per pip. Now I'll wait for a simple recalculation.
- ptyforex replied Mar 26, 2015
At this moment I would scalp buy EU..... The stop loss for the buy is a close under the green line on the chart posted below. image
EURUSD

- ptyforex replied Mar 26, 2015
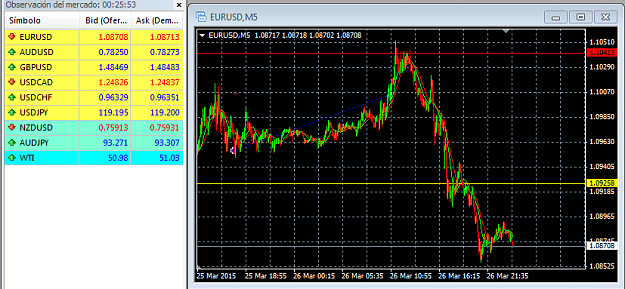
Please remember that the US market is closed, and since their is no global market open at this moment you will see those type of spreads. Unless you with a REAL ECN BROKER. The picture below shows my current spread. image
EURUSD
- ptyforex replied Mar 26, 2015
Have a look at EU at this current moment... You can see that EU has touched one of it's daily pivots. image Once the daily pivot has been touched... We then wait for an official accumulation pattern on the 5m tf. The question would then be...... ...
Accumulation & Daily Pivots

- ptyforex replied Mar 26, 2015
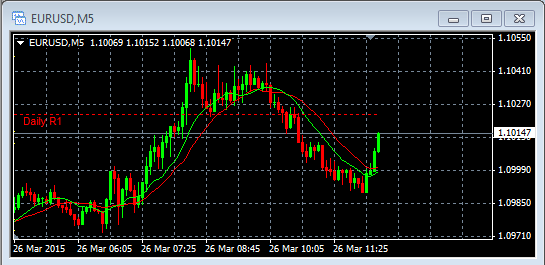
After EU's spike up we can see that it has passed the R1 daily pivot, only to move back down under it, but based on how I calculate "Accumulation" the currency has yet to form accumulation. As we have kept making new lows without any engulfs to the ...
EURUSD
- ptyforex replied Mar 25, 2015
image Are you sure you want to scalp EU for a sell when the bias is this heavy to the short side?
EURUSD

- ptyforex replied Mar 24, 2015
Here are the orders, and the sl... If eu drops 5 pips, it would be a very big profit for me since I was playing pepper with the sl line.
EURUSD

- ptyforex replied Mar 24, 2015
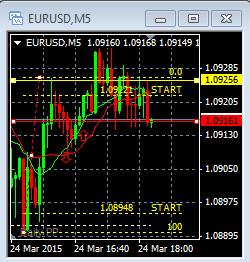
Take the loss on the buy, and take the short now.. Stop loss for the short order is a close across the yellow line on the 5m chart. image
EURUSD
- ptyforex replied Mar 24, 2015
image Have a look at the amount of wicks we have had across 1.09161 on the 5m chart. As of right now EU is a long all the way to 1.09536 BEING THAT it has not been able to close under 1.09161. Should the bid close under 1.09161 on the 5m then you ...
EURUSD

- ptyforex replied Mar 24, 2015
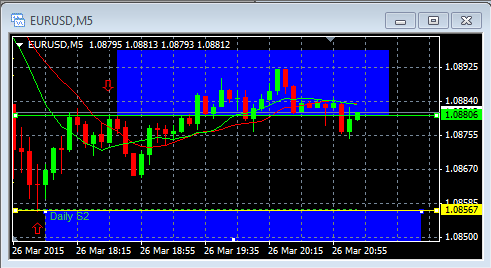
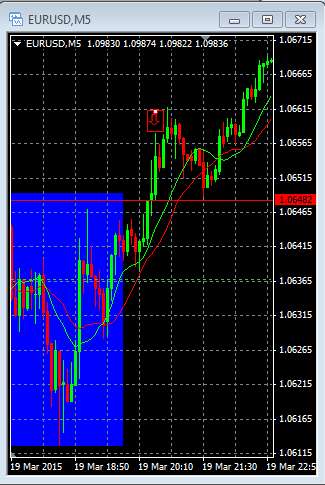
image The picture posted above is "accumulation" on the m5 tf. My strategy is rather simple, and I will give a very broad explanation of it. Once you are in a confirmed accumulation, simple look at the candle which CLOSES making a new high or low ...
EURUSD


- ptyforex replied Mar 23, 2015
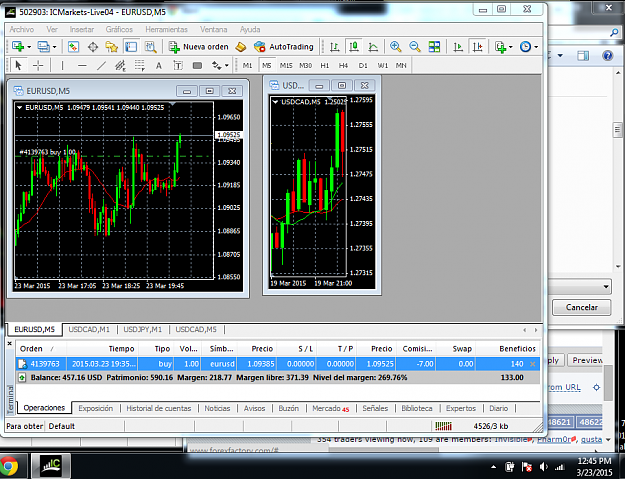
I am long EU, and will trail stop at +8 pips once this open candle on 5m closes. image
EURUSD
- Posts by Member Search: 'ptyforex'