- Search Energy EXCH
- 50 Results (1 Thread , 49 Replies )
-
 ptoftangency replied May 21, 2017
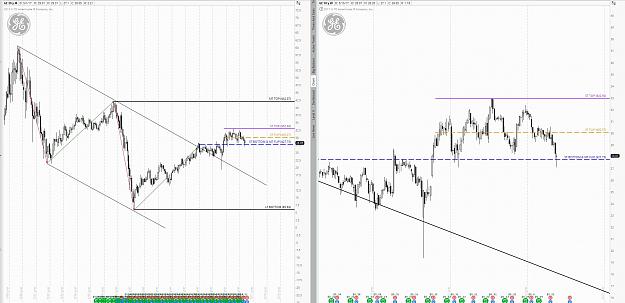
Good points. I agree with EU remaining the guinea pig as it's been on center stage since day one and there are incalculable resources and references available here. Regarding GE, I still struggle with defining ST levels, mostly because I've been a ...
The Really Useless Thread
- ptoftangency replied May 19, 2017
When I started trading FX, I tried to trade intraday and small swings. I absolutely got wrecked, lol. Until I just started looking at a weekly/monthly chart, marking key events/dates and levels. It became much easier, especially when you wait for ...
The Really Useless Thread
- ptoftangency replied May 19, 2017
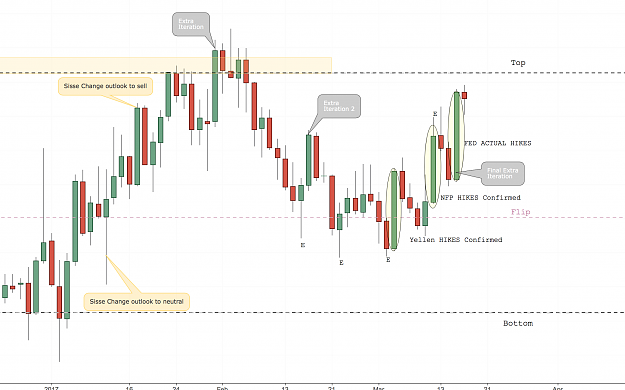
Looks like positioning is taking place for both risk on/off (May 24th Comey). The /ES P/C ratio was over 4 this morning. I don't know what the average is, I'm sure @Fool knows, but that ratio seems very high, despite VIX on the retrace. As Sisse ...
The Really Useless Thread
- ptoftangency replied Jun 15, 2016
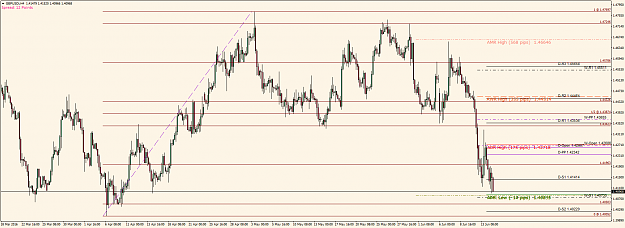
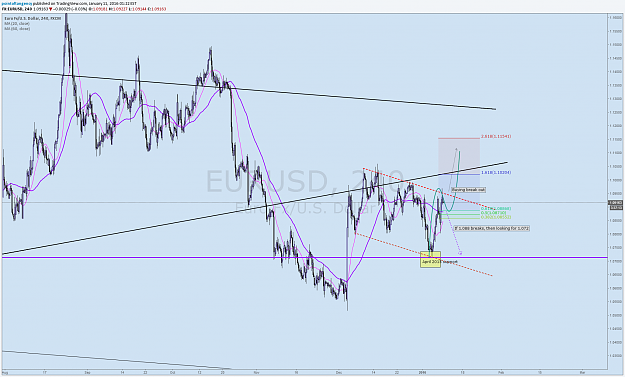
Pharm0r, saw you're chart and thanks for sharing. Question: on the second g.u chart, did you arrive at the price level 1.40503 using a 0.057 fib level? That's the only way am able to replicate that price level. Thanks in advance. image
The Swamp
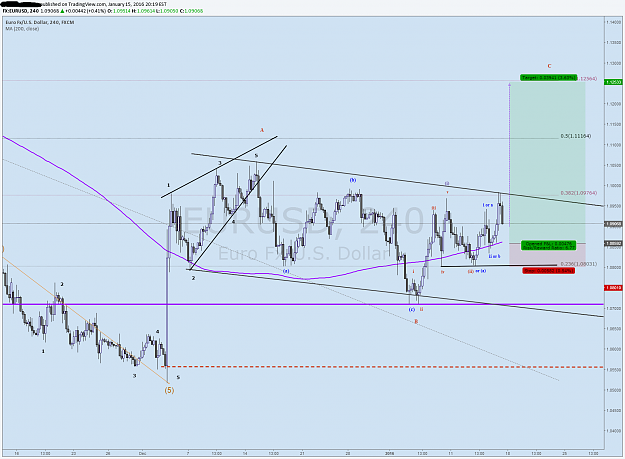
- ptoftangency replied Jan 15, 2016
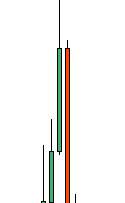
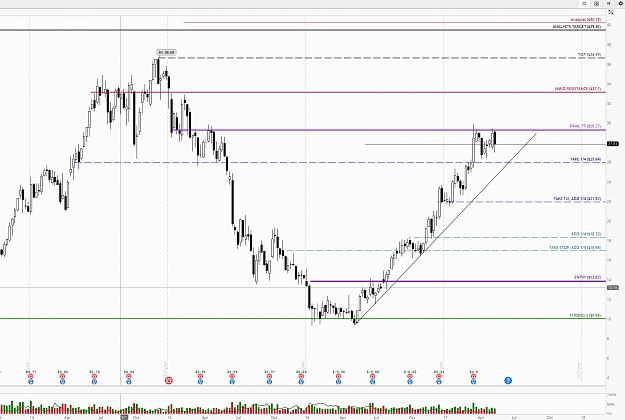
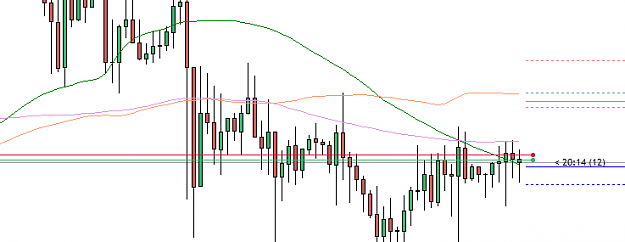
Yeah, weirdness. But the 23.6 is the 4th wave from my previous 5 wave count. Hopefully we see another impluse which I'm targeting the 61.8 (1.125) with stop below the 4th wave support. image
EURUSD
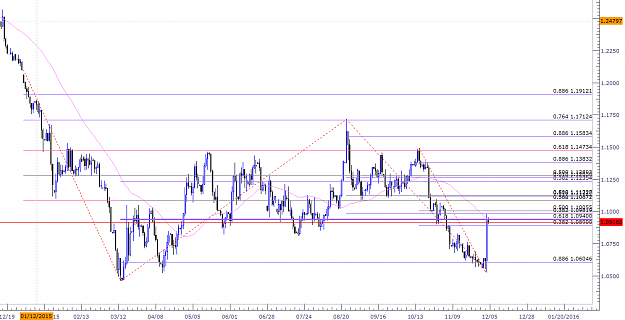
- ptoftangency replied Dec 3, 2015
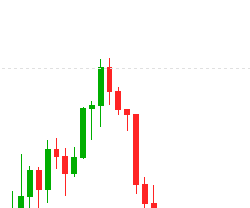
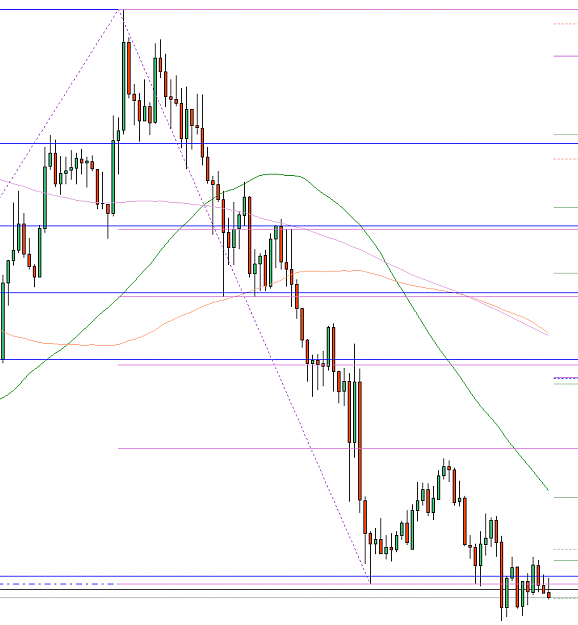
Interesting. Today's rally stopped at the .618 fib which was March 13 low @ 1.0458x to August high @ 1.1794x. image
EURUSD
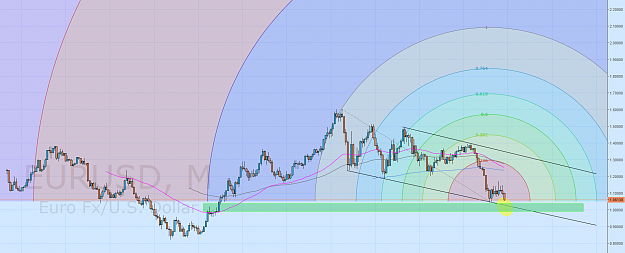
- ptoftangency replied Nov 26, 2015
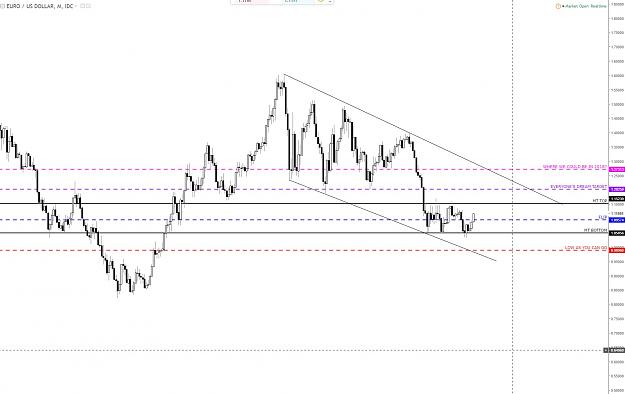
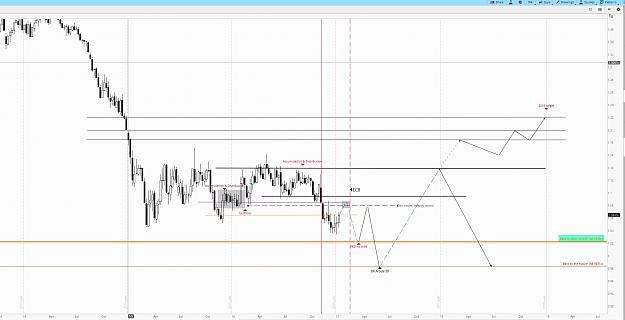
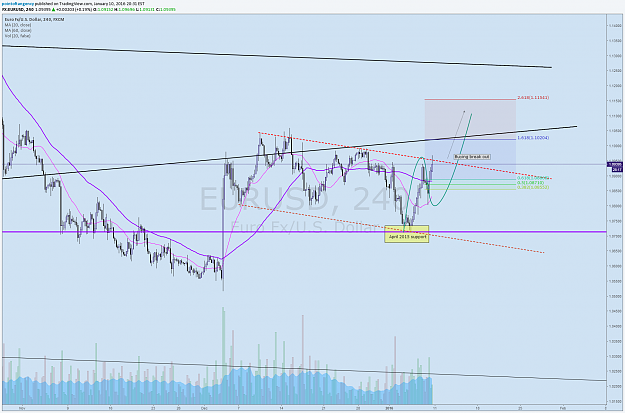
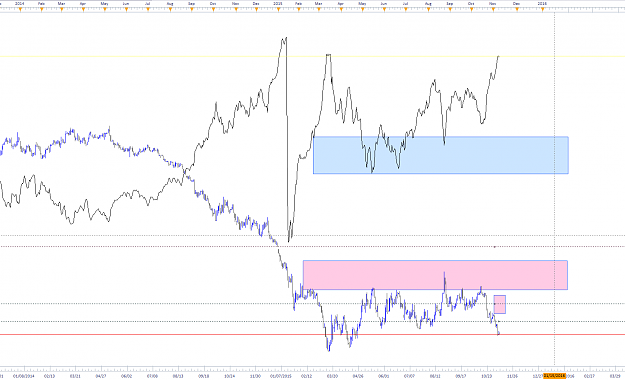
I see. I follow your posting frequently (now subscribed). Are you finding levels through fibs or? What do you think of this monthly chart? image
EURUSD
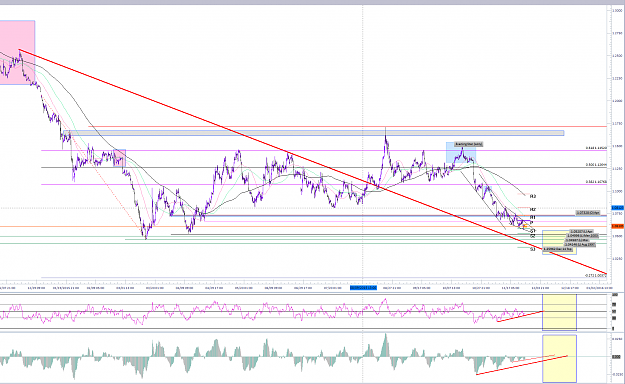
- ptoftangency replied Nov 26, 2015
I gotcha. Here is my painted picture I suppose. Anyways, if you boil up any ideas let me know. Cheers dude. image
EURUSD
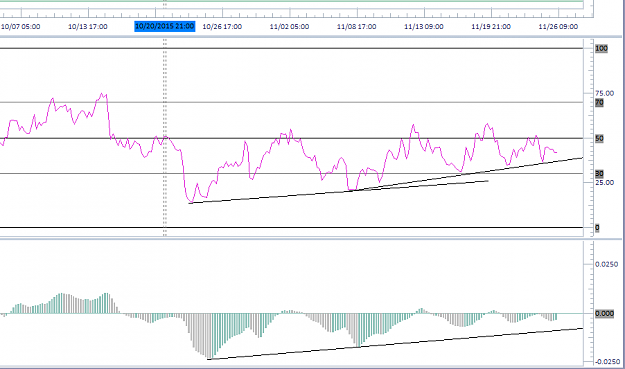
- ptoftangency replied Nov 26, 2015
Max, Noticed this on the RSI and momentum H4. I'm not sure if you use these indicators. I typically don't since you introduced me to the pivot a while back. Coincidentally, I saw in sisse's thread he highlighted the same. I just like hearing your ...
EURUSD
- ptoftangency replied Nov 25, 2015
Haha, love the stops. Awesome.
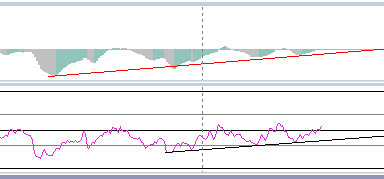
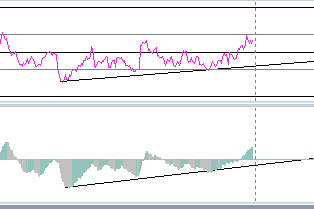
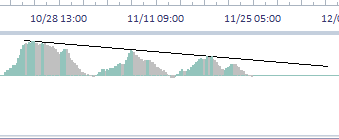
EURUSD I noticed the rsi and momentum slowly making the reversal on the E/U. (H4) image Haven't been following the E/G but, same scenario (H4) image EDIT: And here is USDCHF image
- ptoftangency replied Nov 13, 2015
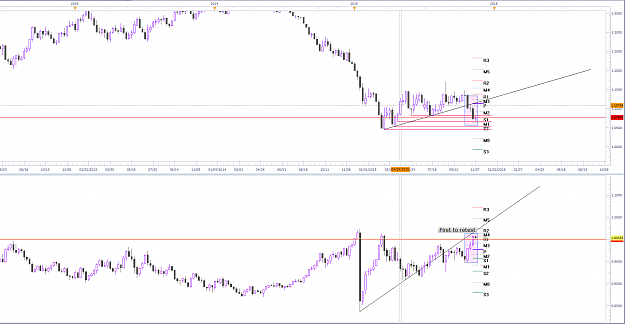
EURUSD Max, gonna try this short until the end of the year. E/U @ 0.9933. Any thoughts? EDIT: Sorry, I realized I provided a lousey chart. E/U upper U/CHF lower Here were go: image
- ptoftangency replied Nov 12, 2015
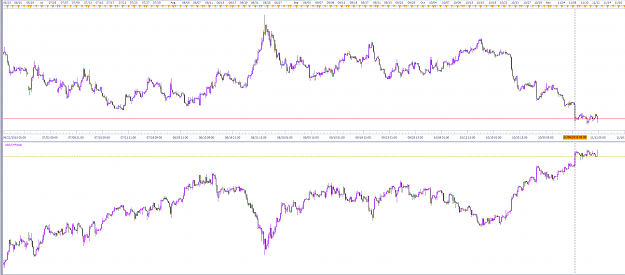
Nice pin on the USD/CHF. E/U on upper chart. Typical correlation pattern between the two pairs. The two are like polar magnets. image
EURUSD
- ptoftangency replied Nov 10, 2015
Feed me your thoughts, I've been looking at this. Edit: Sorry, I should have mentioned that the solid line trend is USD/CHF.
EURUSD
- ptoftangency replied Oct 8, 2015
Definitely noticed this as well. I'm am always looking for the ring pair correlation. U/J H1 over the last few days image E/A H1 over the last few days image
EURUSD
- ptoftangency replied Oct 5, 2015
Jason, Thanks for the response. You're a busy man. From what I gather, it sounds like there is less and less MT4 support taking place. I do like TS; actually I love it, but I haven't acclimated myself to the features just yet. Could I just add a ...
FXCM Discussion