- Search Energy EXCH
- 124 Results
- pooh123 replied Nov 12, 2020
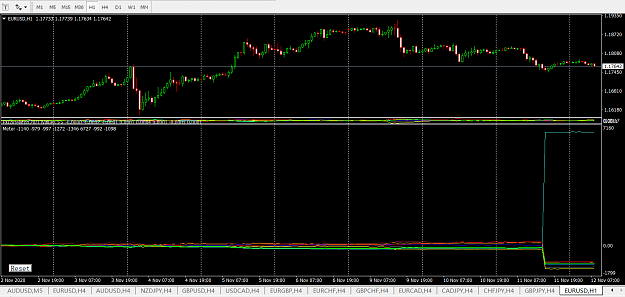
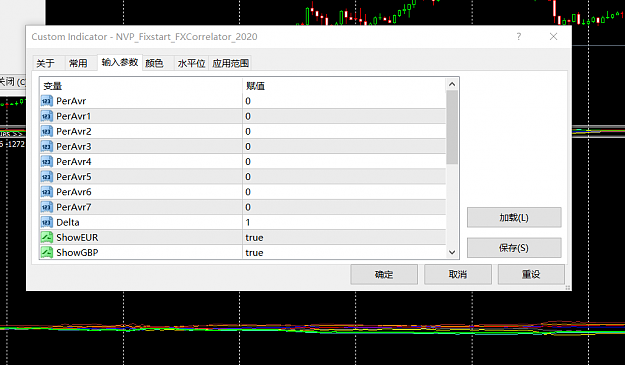
Hi Neil, Your fixed start indicator used to work well on my win7 PC. However recently I migrated to a win10 PC and the change brought some issue. The indicator just doesn't display properly. Do you use the indicator in win7 or win10 ? Anyway to fix ...
FXCorrelator - Scalping system
- pooh123 replied Jul 13, 2020
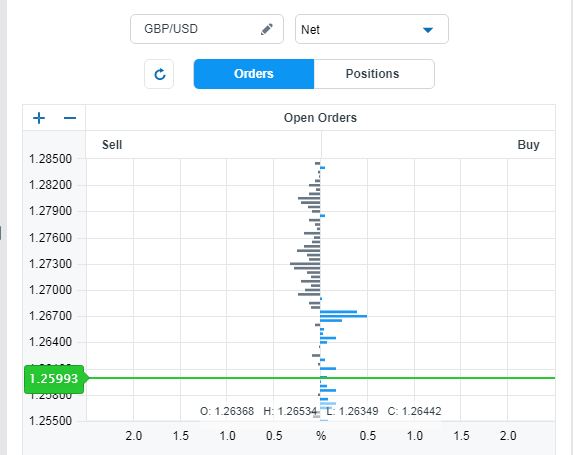
I entered a long too, for a different reason. There are net stops (more stop orders than limit orders) around the level 1.26700. Market Makers might mark price up to take those stops. I'm not sure either. However, the R:R is worth a a try.
vsa with Malcolm
- pooh123 replied Jul 1, 2020
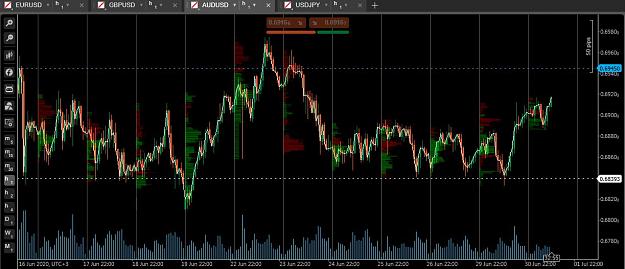
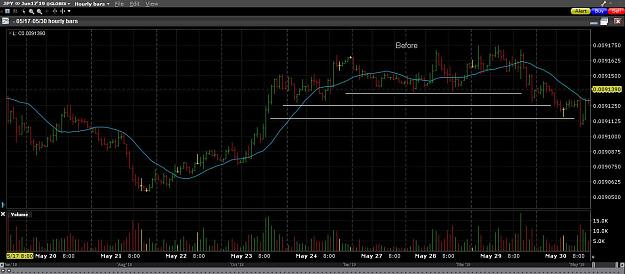
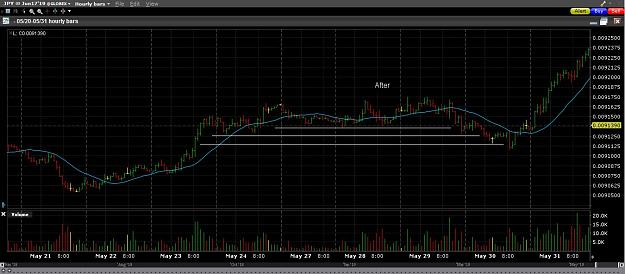
The same old story unfolds again and again. In the AUDUSD chart, the white line marked the sell stops before they were taken out. The blue line marked the buy stops above. Yesterday after the stop run I placed a long trade but took profit too early. ...
Real or Algo
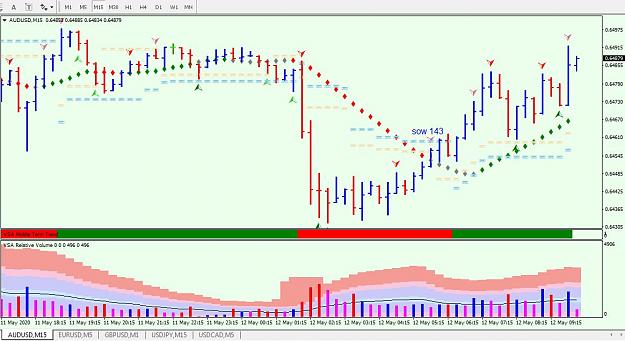
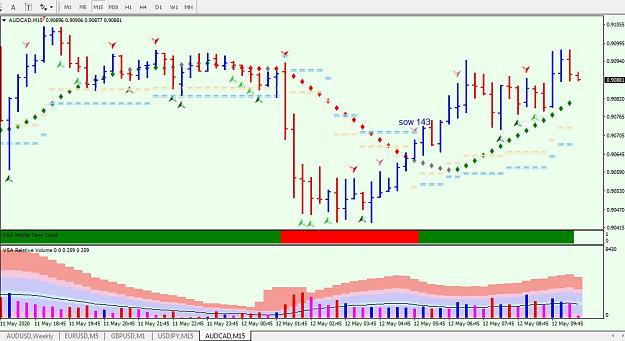
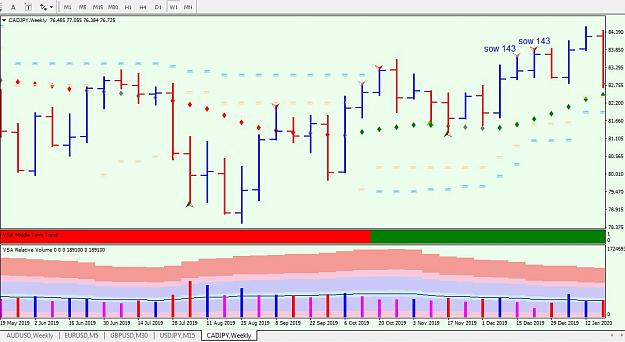
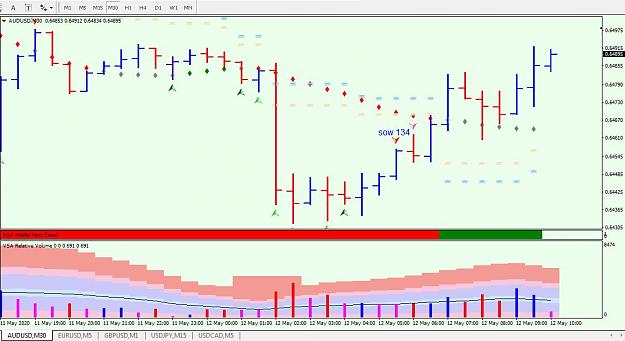
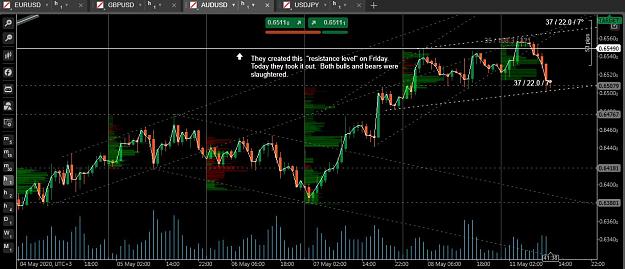
- pooh123 replied May 12, 2020
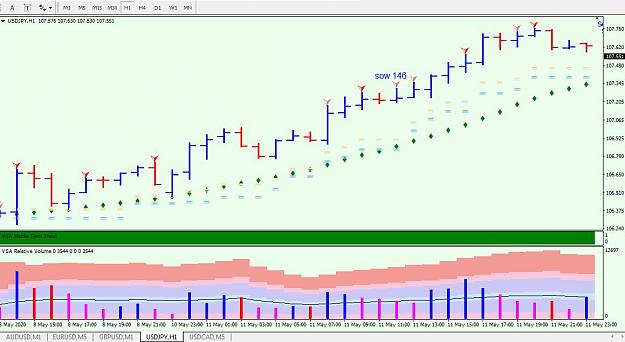
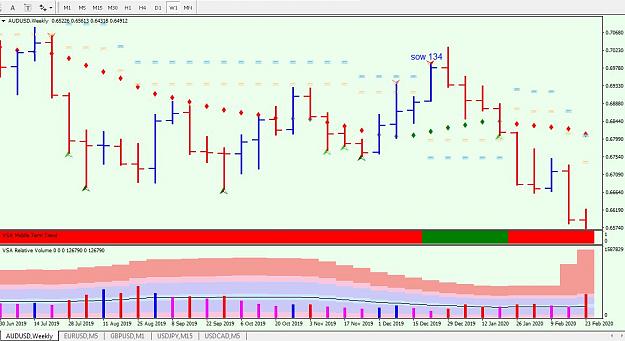
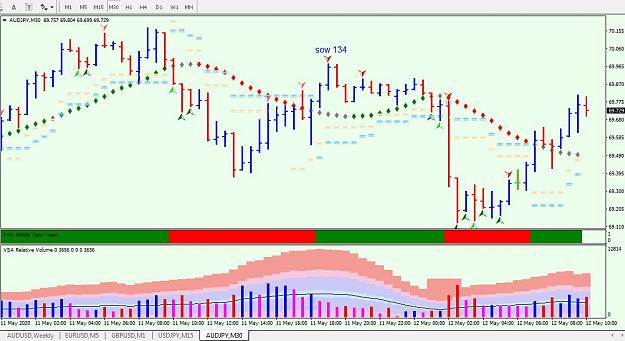
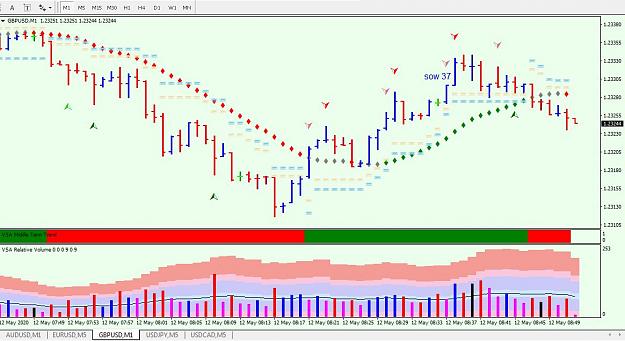
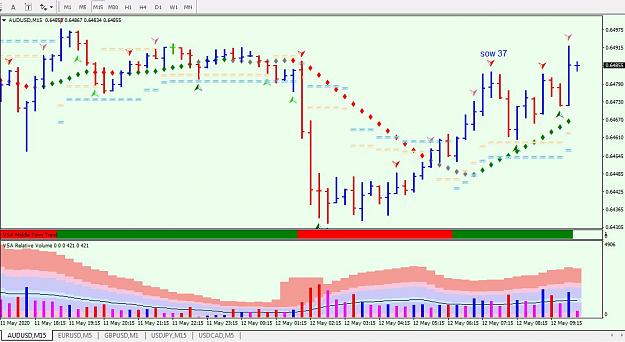
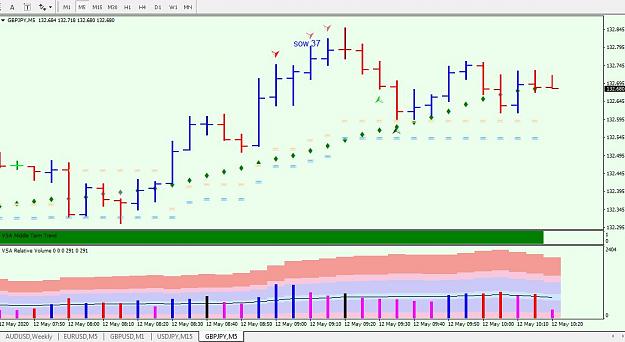
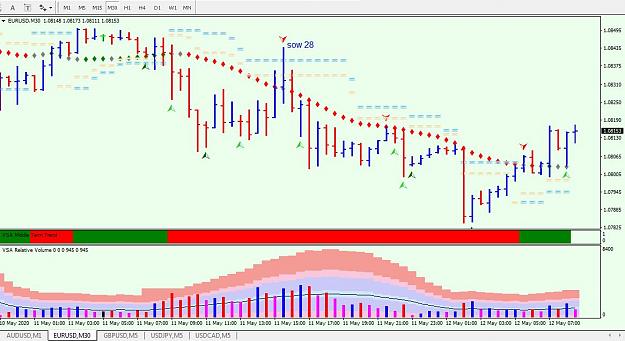
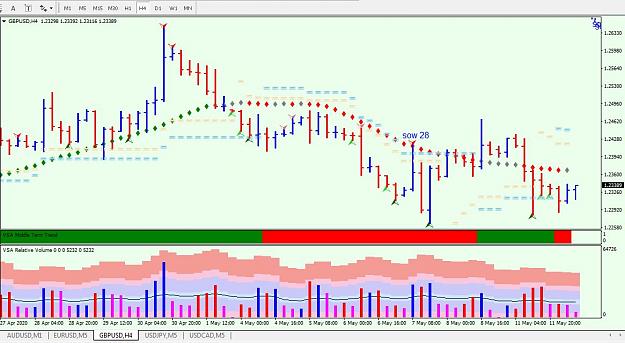
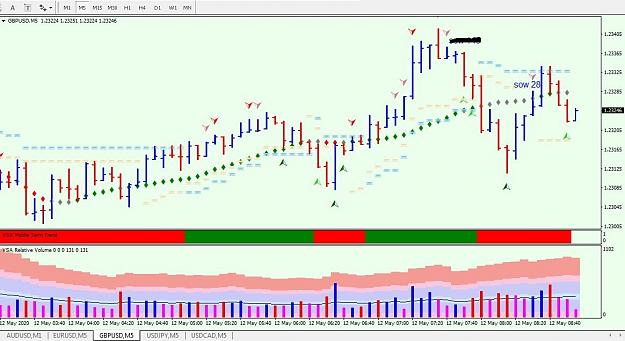
In Tradeguider VSA software and Gavin's book Trading in the Shadow of Smart Money, the following No Demand signals have identical definition but different SOW signal numbers: SOW6, 28, 32, 34, 36, 37, 38, 50, 53, 55, 57, 76, 102, 106, 107, 115, 127, ...
vsa with Malcolm
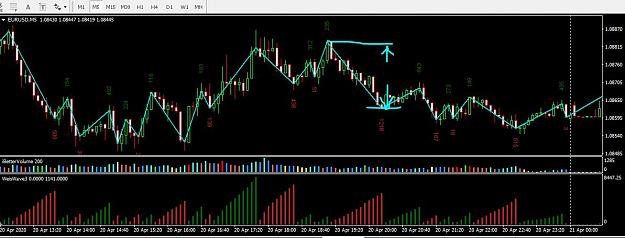
- pooh123 replied Apr 22, 2020
@BlueRain Thanks for your effort. However, it's still not fixed. I checked the data and found it the same. I attached the screenshots from yesterday for the old version and the screenshot from today for the latest version. For the same down wave, ...
I will code your EAs and Indicators for no charge

- pooh123 replied Apr 22, 2020
@BlueRain, Thanks for the latest update. However, I found it still incorrect. Actually I can do some simple coding on my own, so, before you modified it today, I modified it myself this morning and used the exact same code as you did, however, the ...
I will code your EAs and Indicators for no charge
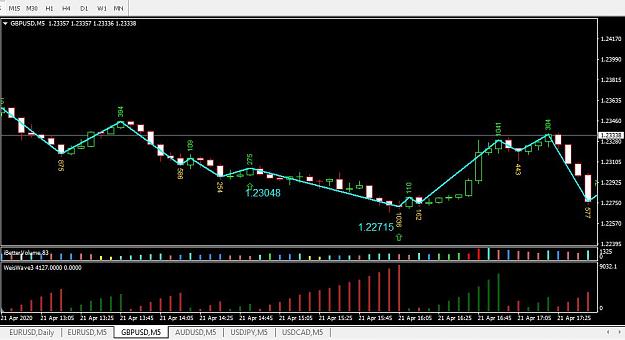
- pooh123 replied Apr 21, 2020
@mntiwana Thanks to you and BlueRain for the work. However, the calculation is till incorrect. I checked the data bar by bar and found it. I didn't make myself clear enough about the request and caused misunderstanding. I'm apologize for that. What ...
I will code your EAs and Indicators for no charge

- pooh123 replied Apr 21, 2020
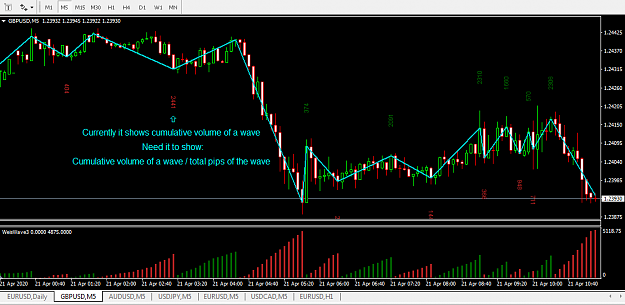
@BlueRain, Sorry I found an issue here. In your calculation you calculate the range of each bar in the wave and add them up. That's not what I want. What I want for the pips of the wave is the total range of the wave, from lowest open to the highest ...
I will code your EAs and Indicators for no charge
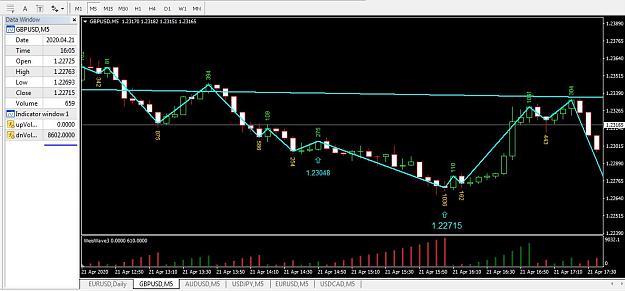
- pooh123 replied Apr 21, 2020
Can someone help me with this please ? I have a Wyckoff wave indicator. Currently it displays on chart the cumulative volume of a wave. Need it to display: cumulative volume of a wave divided by total number of pips of the wave. For example, if the ...
I will code your EAs and Indicators for no charge
- pooh123 replied Jun 6, 2019
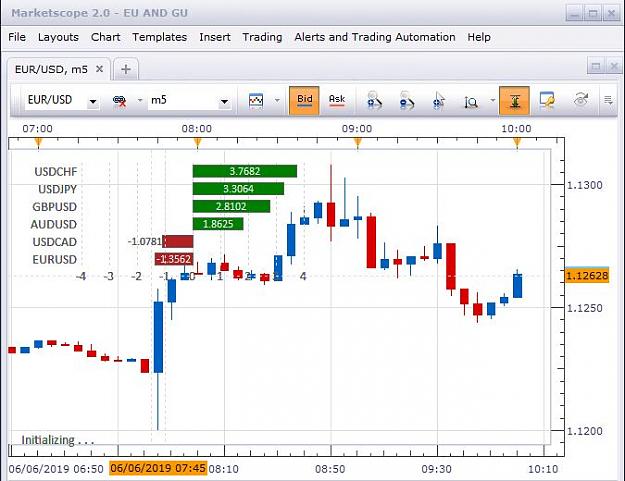
Hi Neil, Why is my SSI indicator different from yours ? Yours looks better. How did you get it ?
(binned per thread starter's request) Currency Strength with cont
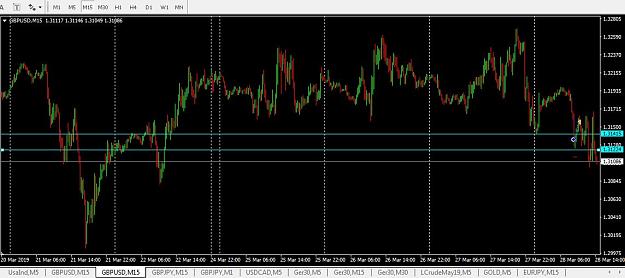
- pooh123 replied Mar 28, 2019
Someone asked me how I got that entry point. Here's how. The area between the two aqua color lines was my target zone (the zone for potential entry). I drew those lines based on that swing low from early morning today. When price entered that zone ...
Price action at the core / tma intra day
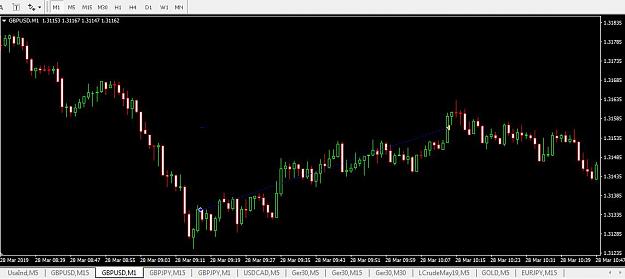
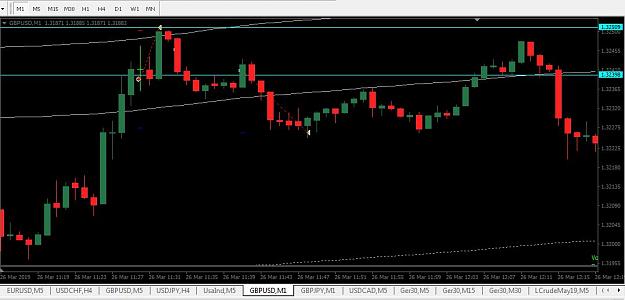
- pooh123 replied Mar 26, 2019
Took two trades yesterday. The first one ended in a loss. The 2nd was a winner. Now I fully understand why George says the following: " What is IMPORTANT for George are 2 things ,,,, NO 1 ,,, ENTRIES ,,, ENTRIES ,,,, ENTRIES ! ! ! ! NO 2 ,,, ...
Price action at the core / tma intra day
- pooh123 replied Jan 30, 2019
FF's latest youtube video as of that post was about the flash crash. It only talked in general term about the move of several currencies during the flash crash , against DM sentiment. Obviously Fractal didn't predict the flash crash. Otherwise he ...
Scammers - Hall of Shame